Walmart Outperform Market Expectations
In the dynamic world of retail, few names stand as tall as Walmart Inc. (WMT). With a legacy spanning decades, this retail giant has consistently delivered both value and convenience to millions of consumers around the world. In this video blog, we delve into the recent bullish performance of Walmart’s stock and explore various potential paths using Elliott Wave theory.
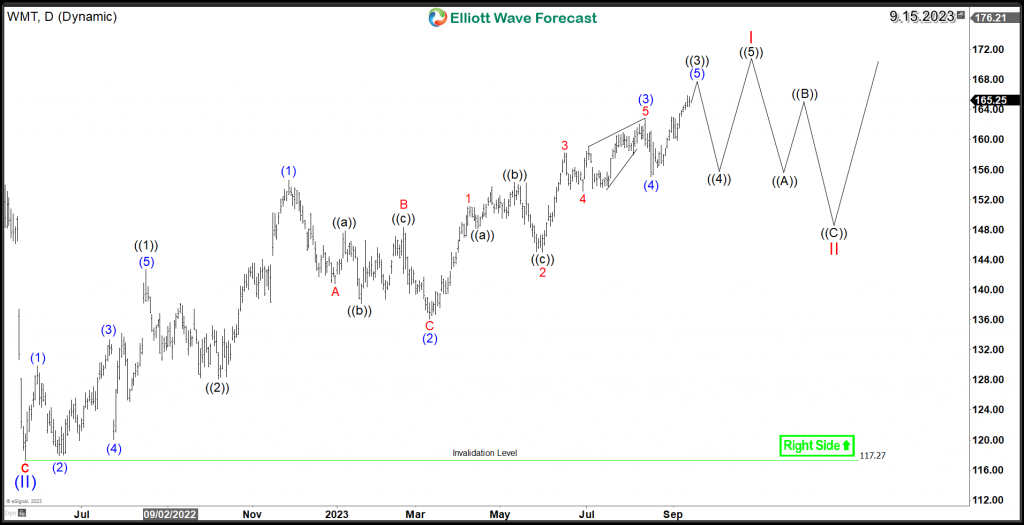
Since May 2022, Walmart (WMT) has experienced a significant surge to the upside, following what appears to be an impulsive structure. The breakthrough above the 2022 peak, resulting in new all-time highs, has confirmed the stock’s bullish trajectory on a weekly scale, with expectations for further continuation against the $117.27 low.
If Walmart’s stock is following a regular 5-wave advance pattern, we can anticipate one more upward swing before completing wave I. This should be followed by a 3-wave pullback in wave II before the stock resumes its upward trend on the daily chart. The wave II pullback is expected to offer an attractive buying opportunity for investors, potentially occurring in 3, 7, or 11 swings, while maintaining support above the $117.27 level.
WMT Daily Elliott Wave Chart 9.15.2023
(Click on image to enlarge)
The following video offers a daily outlook and investment potential using Walmart’s Elliott Wave analysis, alongside various potential scenarios that could affect the outcome.
More By This Author:
Netflix Looking For Double CorrectionAT&T Ended A Downward Cycle, Possible Corrective Bounce Lies Ahead
Novo Nordisk Reacted Higher From Support Area
Disclaimer: Futures, options, and over the counter foreign exchange products may involve substantial risk and may not be suitable for all investors. Leverage can work against you as well as for ...
more


