

An instrument that has given us a nice trading setup recently is the EUR/USD forex pair. In this article, we’re going to take a look at the past charts of the EUR/USD pair presented in members area of the of the Elliottwave Forecast.
EUR/USD is showing bearish impulsive sequences in the cycle from the May peak. We saw a short-term recovery in the form of a wave 4 pattern that has given us the opportunity to enter short trades again.
EUR/USD One-Hour Elliott Wave Analysis for Nov. 18, 2021
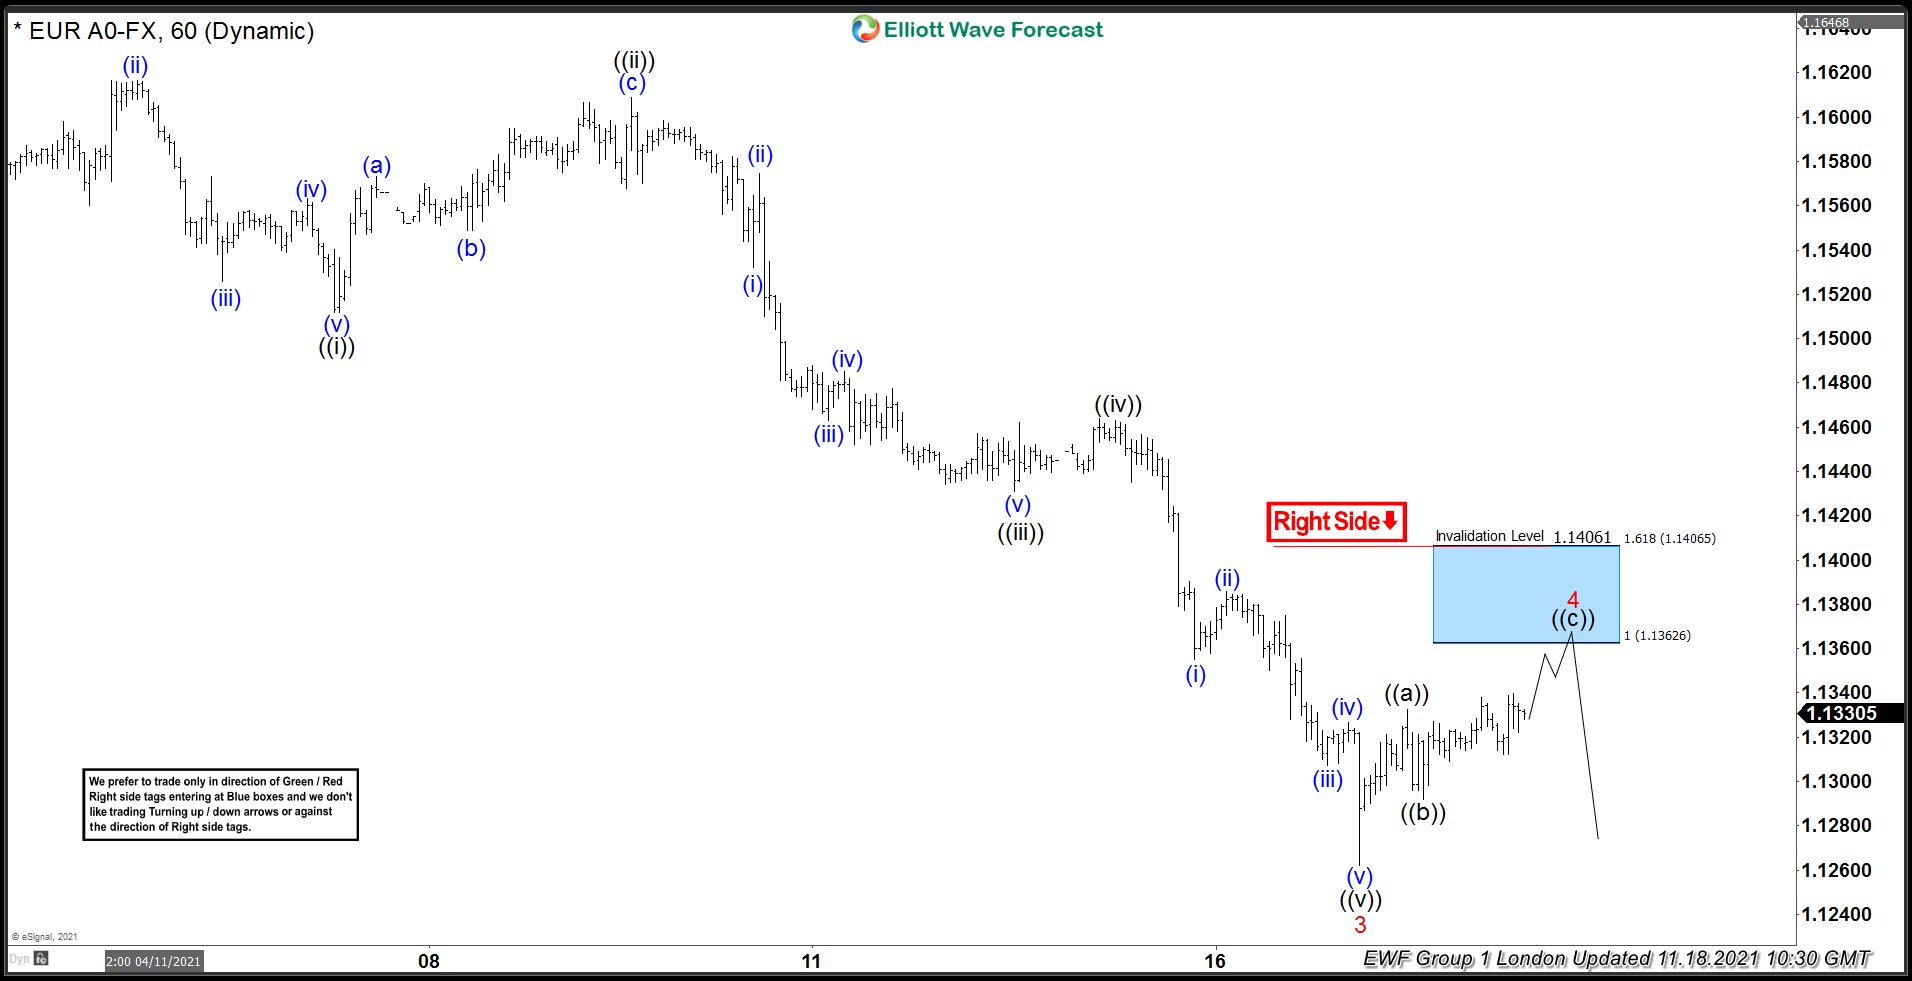
The EUR/USD pair is giving us a 4-point recovery (red) pattern that is unfolding as an Elliott Wave Zig-Zag Pattern. It is illustrated with the ((a))((b))((c)) inner labeling. This recovery looks incomplete at the moment, suggesting more short-term strength may lie ahead.
The forex pair is looking for the 1.1362-1.1406 area to complete the recovery. At the marked blue box area we expect intraday sellers to appear and pull the price lower toward new lows or to alternatively pull back. The invalidation level for the trade is if it were to break above the 1.618 fib. extension (1.14065).
EUR/USD One-Hour Elliott Wave Analysis for Nov. 20, 2021
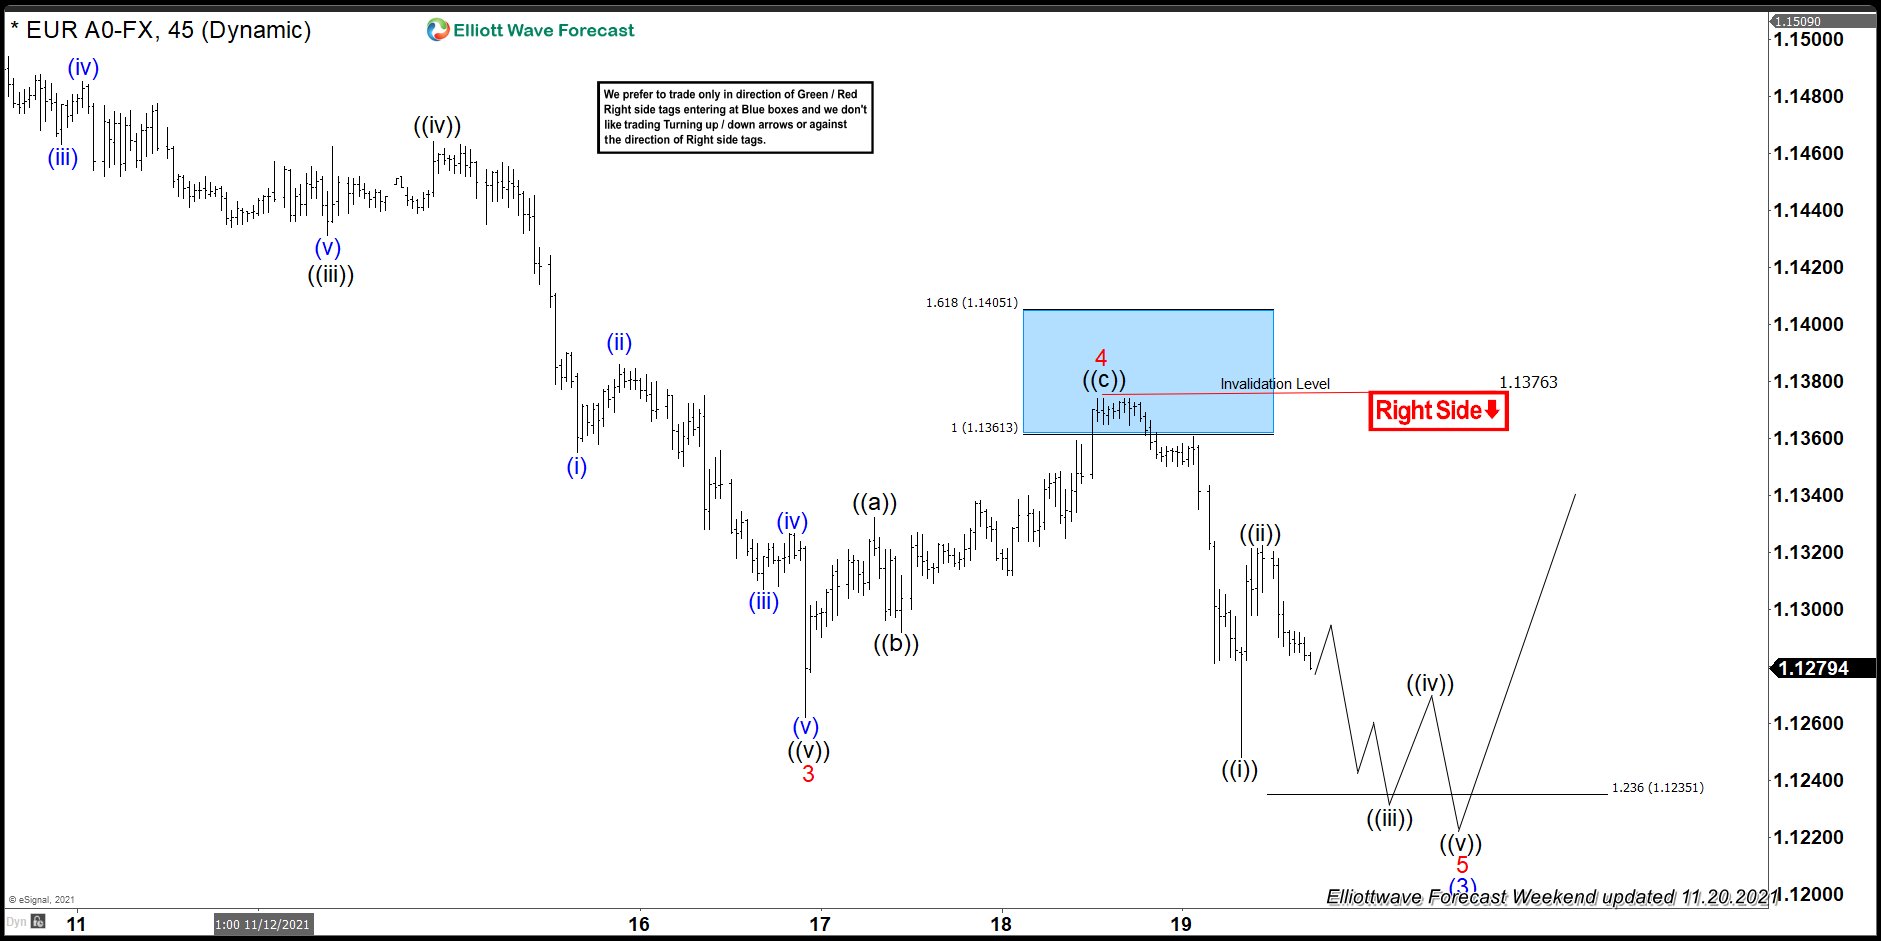
Sellers appeared at the blue box zone, and we saw a good reaction from there. The decline from the blue box unfolded in the form of 5 waves, and the price made a break toward new lows.
As a result, short positions from the blue box appear to have had a risk-off approach, and partial profits were taken. At this stage, the pair remains bearish against the 1.3763 high. As our members know, blue boxes are not bad indicators, giving us an 85% chance to get a reaction.



Comments
Log in or sign up to join the conversation.