
EURUSD has been trending lower inside a descending channel that’s been in place since mid-April, and the pair is currently in the midst of a corrective pullback after finding support near the 1.1498 swing low.
The bounce is now testing the Fibonacci retracement levels that align with the channel resistance, raising the question of whether sellers will return at these levels to resume the broader downtrend.
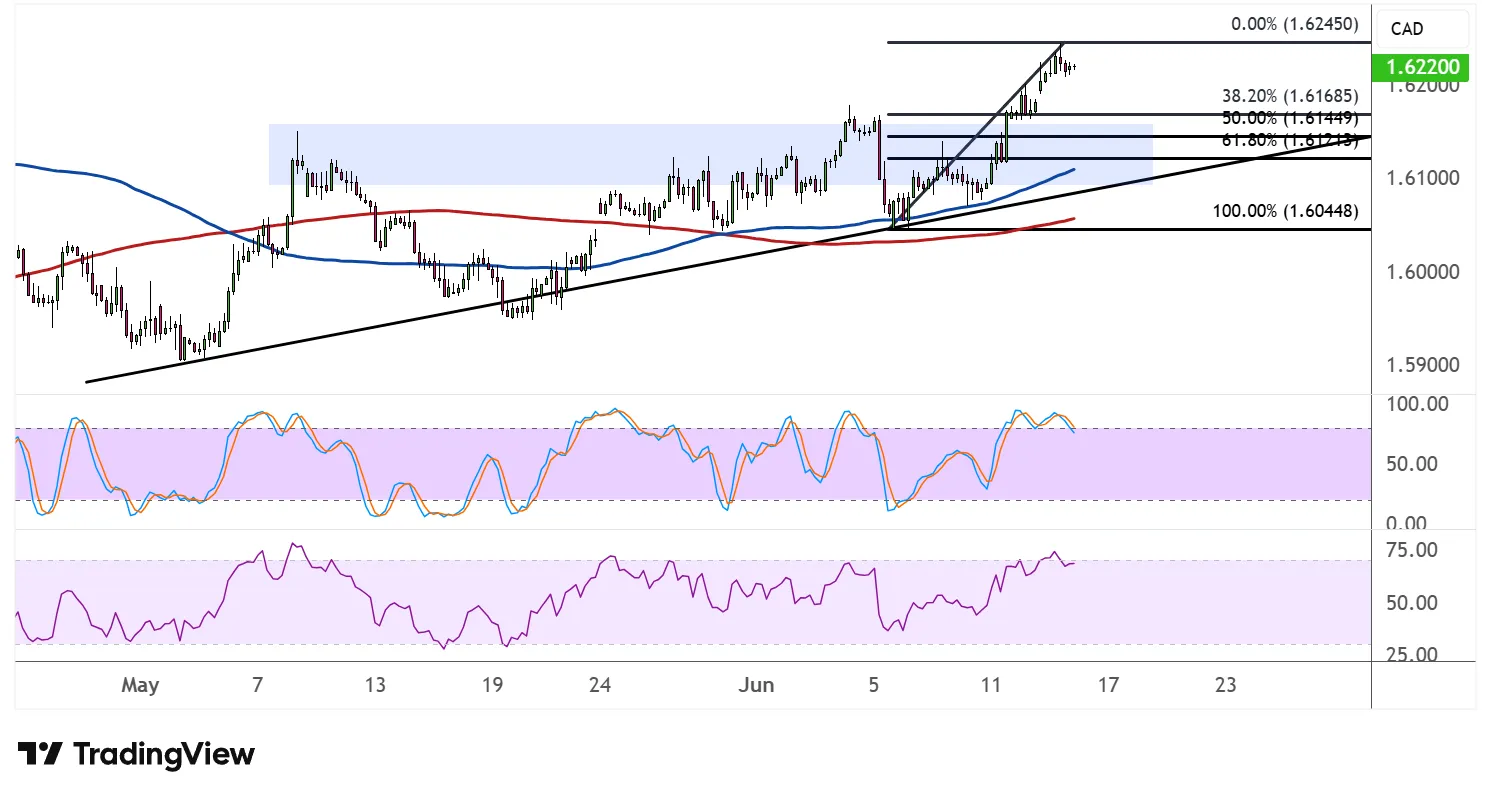
The Fibonacci retracement tool drawn from the 1.1691 swing high to the 1.1498 low marks the key ceilings to watch on the recovery. The 38.2% Fib is at 1.1572, followed by the 50% level at 1.1594.
A deeper retracement could reach the 61.8% Fib at 1.1617, which coincides closely with the descending channel resistance and the broken structure overhead that could now act as a formidable ceiling. If any of these levels cap the bounce, EURUSD could reverse back toward the swing low or push to fresh lows below that floor.

The 100 SMA is below the 200 SMA to confirm that the path of least resistance is to the downside or that the broader selloff is more likely to gain traction than to reverse. Both moving averages are sloping lower and sitting well above current price, reinforcing the case for continued bearish pressure once the pullback runs its course.
Stochastic has turned sharply higher from the oversold area, reflecting a return of bullish pressure in the near term, and is already climbing toward the midpoint of its range. This supports the case for a continued corrective bounce toward the Fibonacci levels before sellers potentially take over again.
RSI has also pivoted upward from its recent lows and appears to have room to climb before reaching the overbought zone, suggesting the pullback could have a bit more room to extend. A reversal in either oscillator near current resistance levels, however, would be an early signal that the downtrend is ready to resume.

Comments
Log in or sign up to join the conversation.