

This week, global market attention will be focused on two key themes: the prospects for a US-Iran agreement and the Federal Reserve meeting.
Any signs of progress in the negotiations could reduce the geopolitical premium in oil prices and weaken support for the US dollar as a safe-haven asset.
At the same time, the market is awaiting the first Fed meeting under Kevin Warsh, which will set the tone for interest rate expectations for the second half of the year.
This is especially important for EURUSD, as strong US inflation and labour market data released a week earlier strengthened the dollar’s position and reinforced expectations that the Federal Reserve will maintain a tight monetary policy stance.
Meanwhile, investors will also assess the impact of the European Central Bank’s recent rate hike and further signals from the European regulator.
Additional influence on the pair’s dynamics will come from US retail sales, industrial production, and other macroeconomic indicators. These releases will help clarify the outlook for the US economy and monetary policy.
EURUSD Technical Analysis
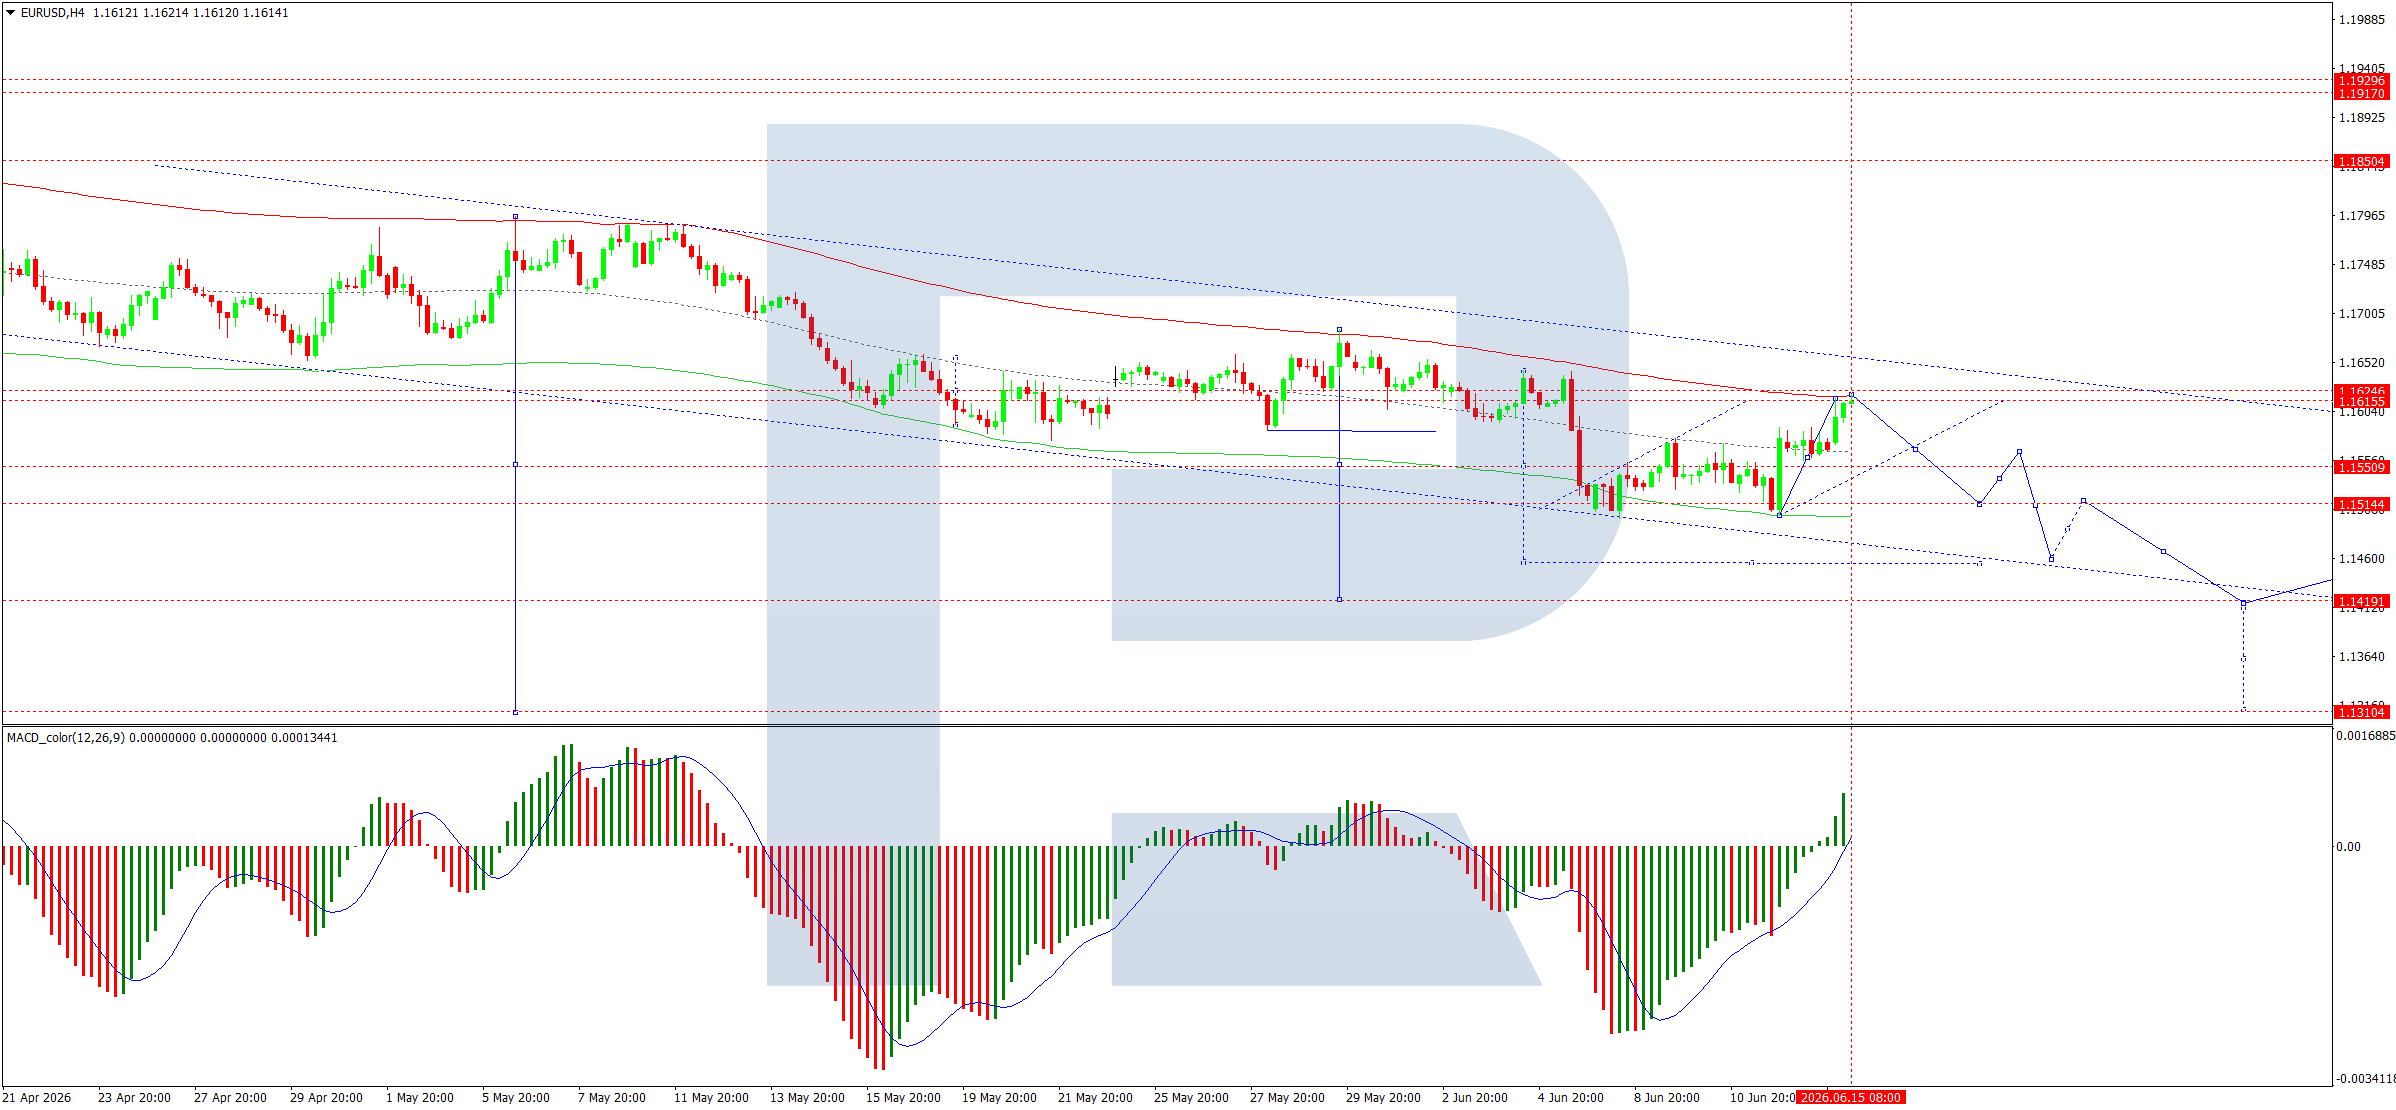
On the H4 chart of EURUSD, the market has formed a consolidation range around 1.1575 today. At the moment, the range has expanded downward to 1.1550.
If the pair breaks out of this range to the upside, a corrective wave towards 1.1612 may develop. After that, a decline towards 1.1500 is expected. If the price breaks below the range, the market may open the potential for a downward wave towards 1.1444.
Technically, this scenario is confirmed by the MACD indicator: its signal line is above the zero level and is directed sharply downward, reflecting a persistent bearish impulse with the potential for the downtrend to continue.
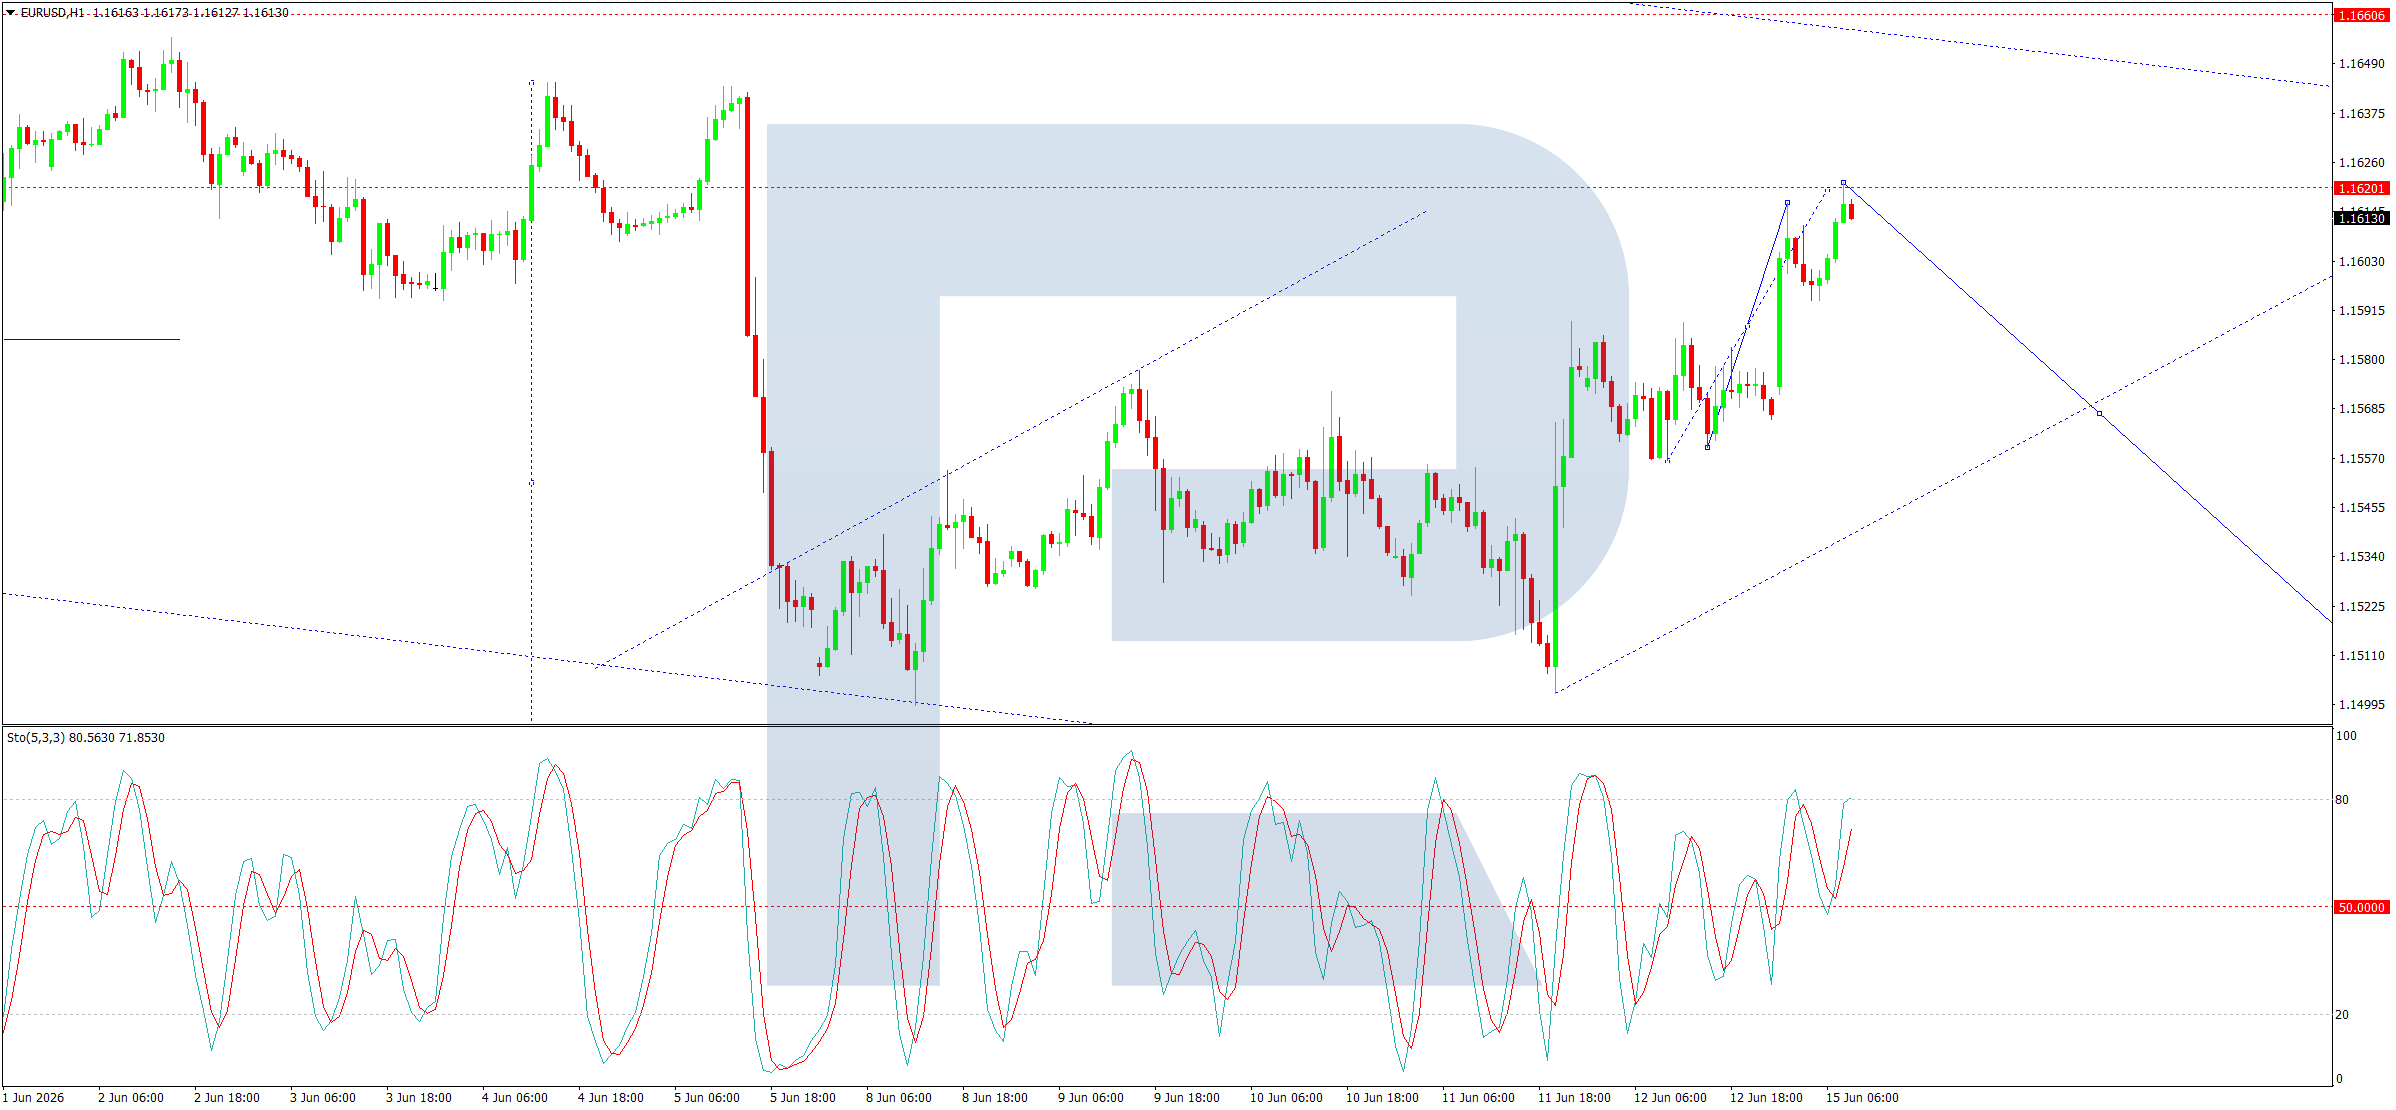
On the H1 chart, the market has completed the structure of another growth wave towards 1.1612. A consolidation range is currently forming below this level.
Today, the relevant scenario suggests a possible expansion of the range downward to 1.1500 and upward to 1.1550, followed by a decline towards 1.1444.
Technically, this scenario is confirmed by the Stochastic oscillator: its signal line is below the 80 level and is directed sharply downward towards 20.


Comments
Log in or sign up to join the conversation.