


The Euro reversed course after reaching a two-day high of 1.1563, following the release of a benign US inflation report for July, which triggered a repricing for a less “hawkish” Federal Reserve, throughout 2026. Despite this, EUR/USD retreated from earlier gains, trading at 1.1522, down 0.17% at the time of writing.
EUR/USD reverses course despite benign US CPI as traders await PPI and Eurozone data
Inflation in the US prompted investors to cut their positions, expecting a rate hike at the September meeting. The odds swung dramatically, with the odds of a hold at 60%, up from 40% before the release of the Consumer Price Index (CPI).
The US CPI for July was in line with expectations, indicating ongoing disinflation. The overall CPI declined slightly from 3.5% to 3.4% YoY, while the core CPI decreased from 2.6% to 2.5% over the twelve months ending in July.
Across the pond, the Eurozone docket showed that Germany’s Harmonised Index of Consumer Prices (HICP) in July held steady at 2.8%, unchanged as expected. Despite this, economists warned that energy prices continued to rise at an above-average rate, remaining a crucial driver for inflation.
On Thursday, the Eurozone’s schedule will feature the release of inflation data from Spain, alongside an update on Industrial Production in the European Union. Projections for the production suggest that economists see an improvement in June from a -1.2% contraction on an annual basis, up to -0.8%
In the US, the Producer Price Index (PPI), along with the Consumer Price Index (CPI), could guide the Federal Reserve’s interest rate path.
EUR/USD Price Forecast: Technical outlook
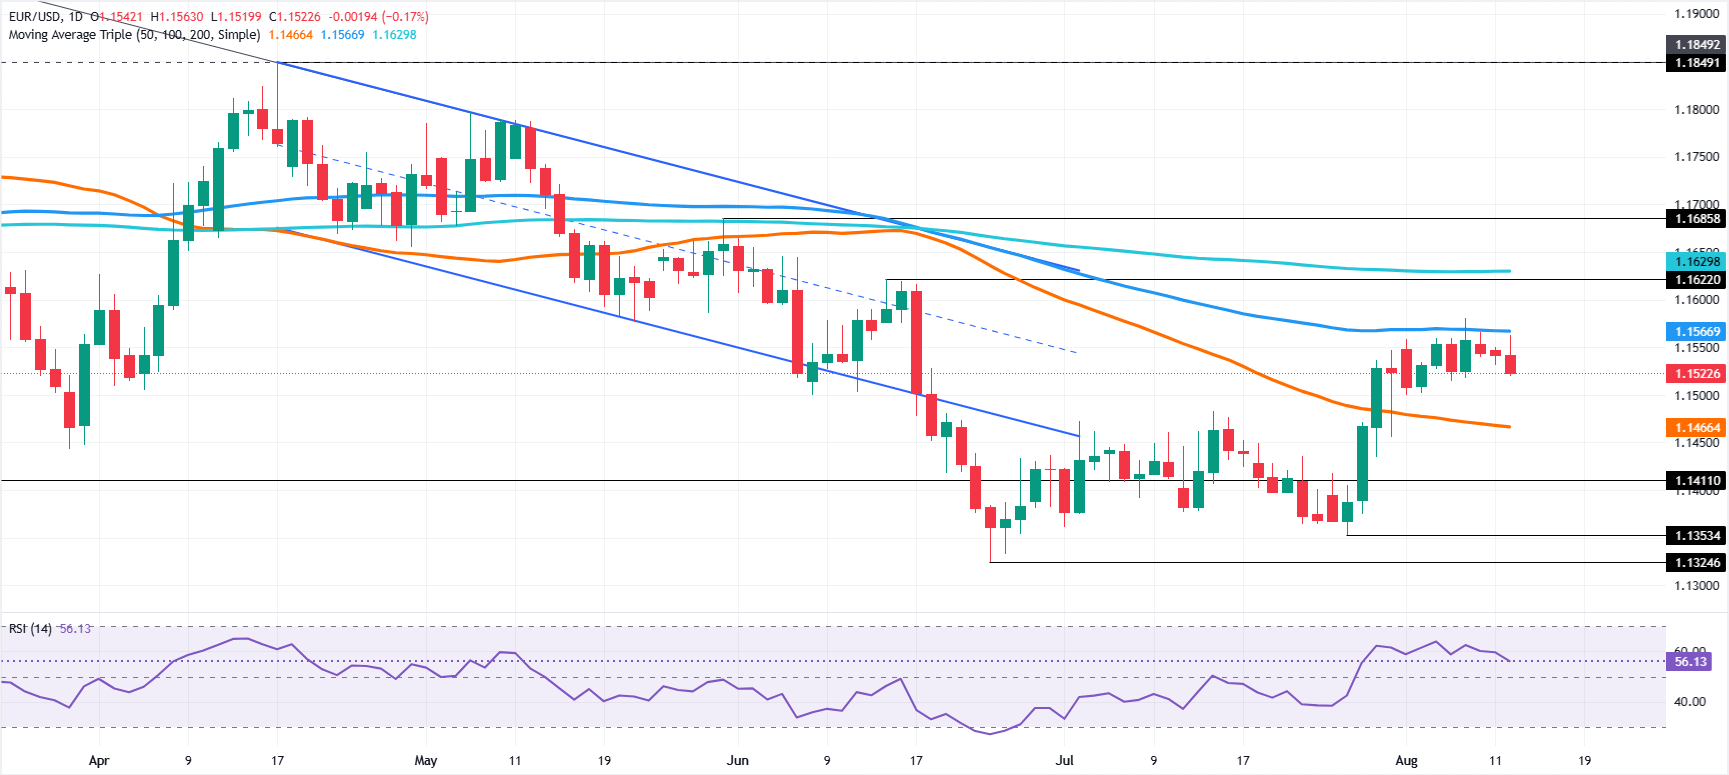
In the daily chart, EUR/USD trades at 1.1523, holding a mildly bullish bias as it grinds above the broken downtrend line at 1.1514 and the top of the descending parallel channel at 1.1510. The latest simple moving averages cluster around 1.1466 below price, suggesting underlying demand, while the Relative Strength Index (14) near 56 points to constructive but not overextended momentum after the recent recovery off the lower channel boundary at 1.1336.
On the downside, initial support emerges in the 1.1514–1.1510 area, where the reclaimed trend-line and channel top converge, followed by the moving average support zone around 1.1466 and then the channel floor at 1.1336 if sellers regain control. On the topside, the next notable resistance is the horizontal barrier at 1.1849, and only a sustained break above this level would significantly strengthen the bullish outlook for the pair.



Comments
Log in or sign up to join the conversation.