


The Euro extends its losses against the US Dollar on Monday, even falling below the psychological 1.1200 level as sellers step in following hawkish comments from a Fed policymaker and growing geopolitical concerns on two fronts: the US-Iran war and Russia’s invasion of Ukraine. The EUR/USD trades at 1.1155, down 0.40%.
EUR/USD tumbles towards 1.1150 as geopolitical tensions reinforce US inflation concerns
The Columbus Day holiday kept the markets quiet, with the cash markets closed. But over-the-weekend news, with US President Trump announcing a ceasefire in the Russia-Ukraine war on energy facilities, was cheered by investors, who later scrambled to buy Oil as Ukraine’s President Zelenskyy warned that hostilities will remain if Russia attacks infrastructure.
Tensions in the Hormuz remain high, even though Iran revealed that the US agreed, in some form, to the seven conditions Tehran required to reopen the Strait. This pushed West Texas Intermediate (WTI) higher, with WTI ending Monday’s session up over 1.60% at $93.17.
The US economic docket was absent, yet eyes were on Cleveland Fed President Beth Hammack, who commented that higher rates are needed as inflation broadens and that, within the FOMC, she has one of the highest projections for the neutral rate.
Ahead this week, traders' focus will be on Fed speakers, led by Fed Chair Kevin Warsh, and on the release of US inflation figures, with the Consumer Price Index (CPI) expected on October 14, followed by the Producer Price Index (PPI) on October 15.
In the European Union, investors would target the release of Germany’s Harmonized Index of Consumer Prices (HICP) and speeches by European Central Bank (ECB) members Elderson and Escriva.
EUR/USD Price Forecast: Technical outlook
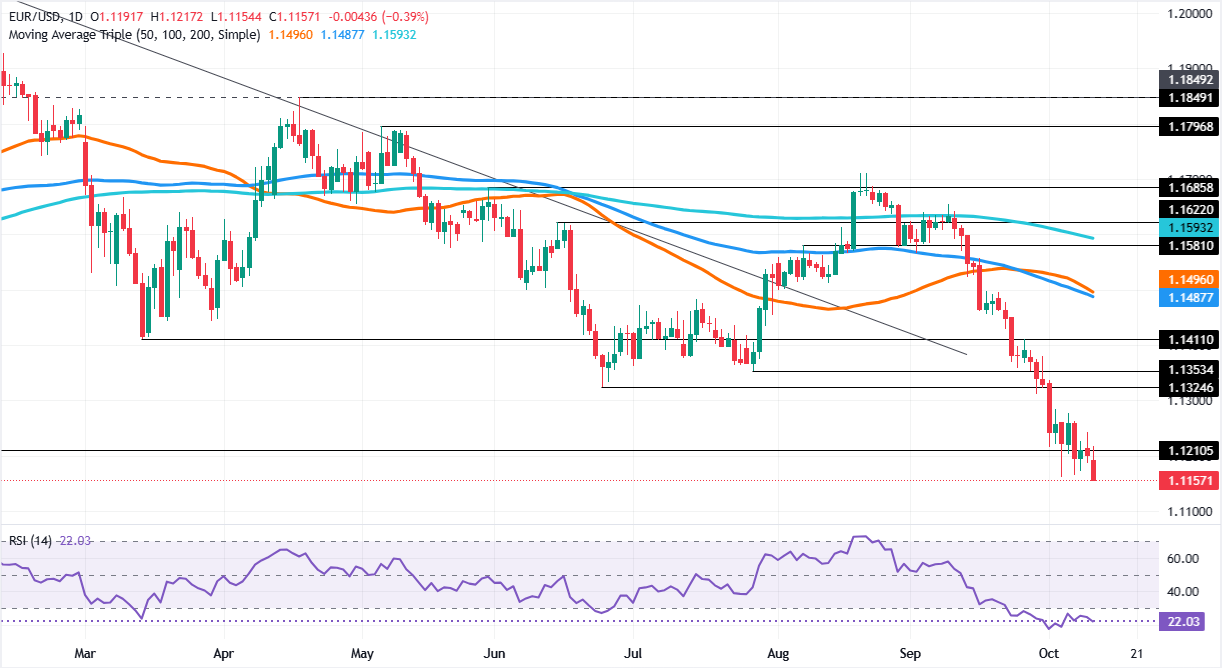
In the daily chart, EUR/USD trades at 1.1157, extending a bearish phase as spot holds well below the clustered simple moving averages (SMA) group around 1.1496. The pair also remains under the long-running downward resistance trend line, whose break reference near 1.1295 now acts as an additional cap, while the Relative Strength Index (RSI) at about 22 stays deep in oversold territory, hinting that sellers remain in control even if short-lived corrective rebounds become more likely.
On the topside, initial resistance emerges near the former break area of the descending trend line around 1.1295, ahead of the dense 50-, 100- and 200-day SMA band at roughly 1.1496, which reinforces the broader bearish structure. Further up, the horizontal barrier at 1.1849 represents a more distant obstacle whose recovery would be required to alleviate the medium-term downside pressure.



Comments
Log in or sign up to join the conversation.