

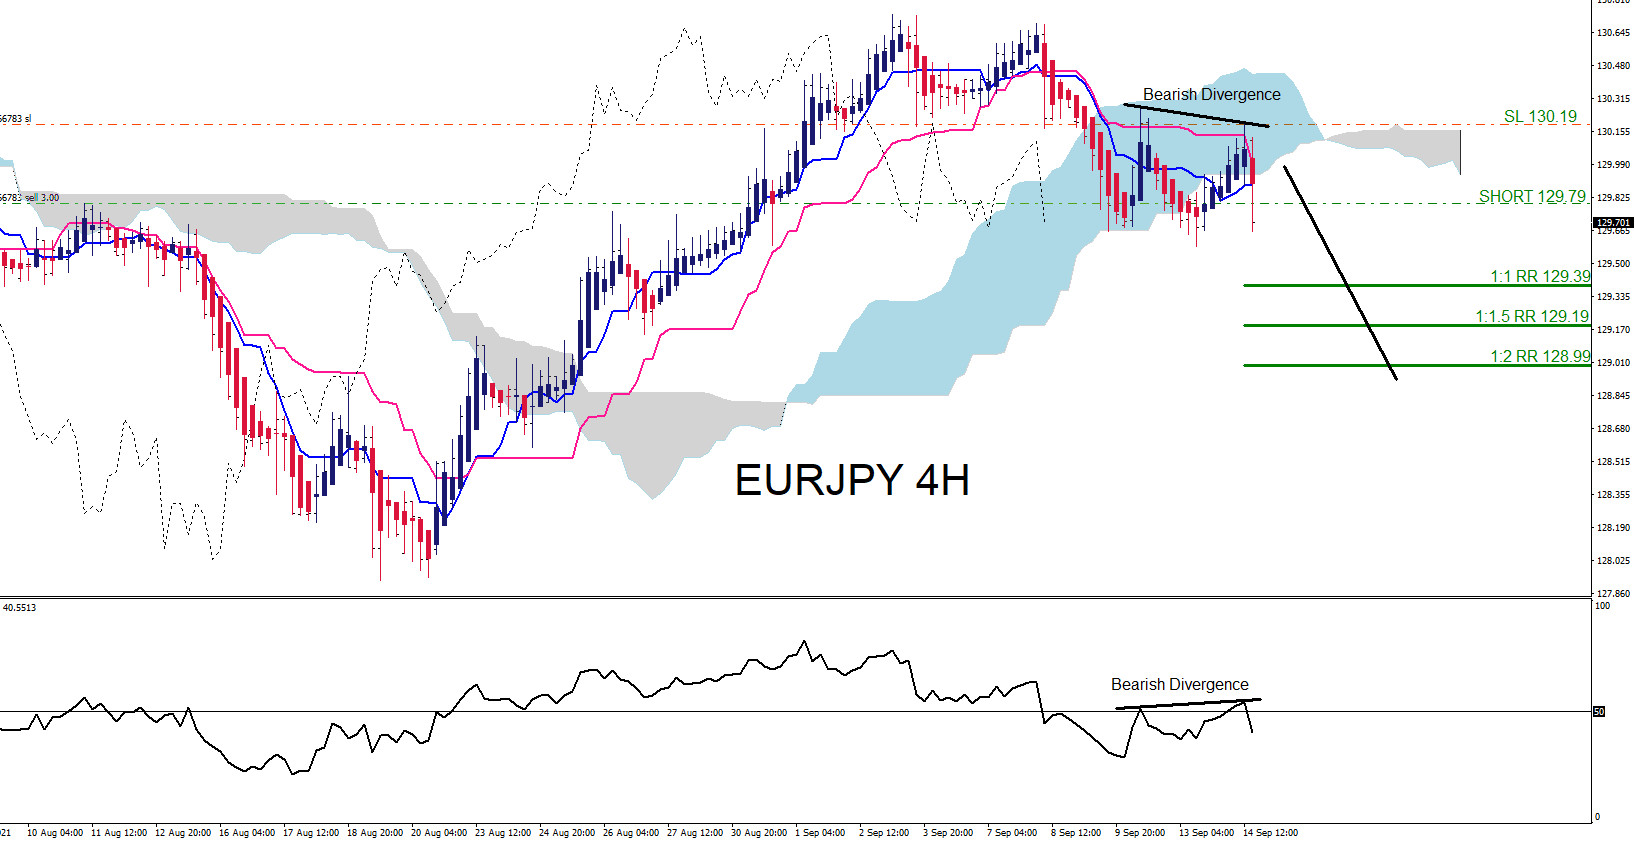
On Sept. 14, 2021, I posted on social media: “EUR/JPY -- Short: 129.79, Stop Loss: 130.19, Target: 129.39 – 128.99 area.“ The chart below was also posted on social media, showing the possible EUR/JPY bearish scenario. Price formed a bearish divergence pattern (black) on Sept. 14, 2021, and was then followed with a move lower. The Tenkan (blue) pattern was below the Kijun (pink) pattern, signaling a bearish view.
The EUR/JPY pair retraced back to the cloud and Kijun (pink) pattern, which could offer a good dynamic resistance zone, and the future Kumo cloud (grey) pattern was also bearish. I entered the Sell trade at 129.79 with a Stop Loss at 130.19 and Targets at the 1:1 RR minimum, with full target at the 1:2 RR.
EUR/JPY Four-Hour Chart: Sept. 14, 2021
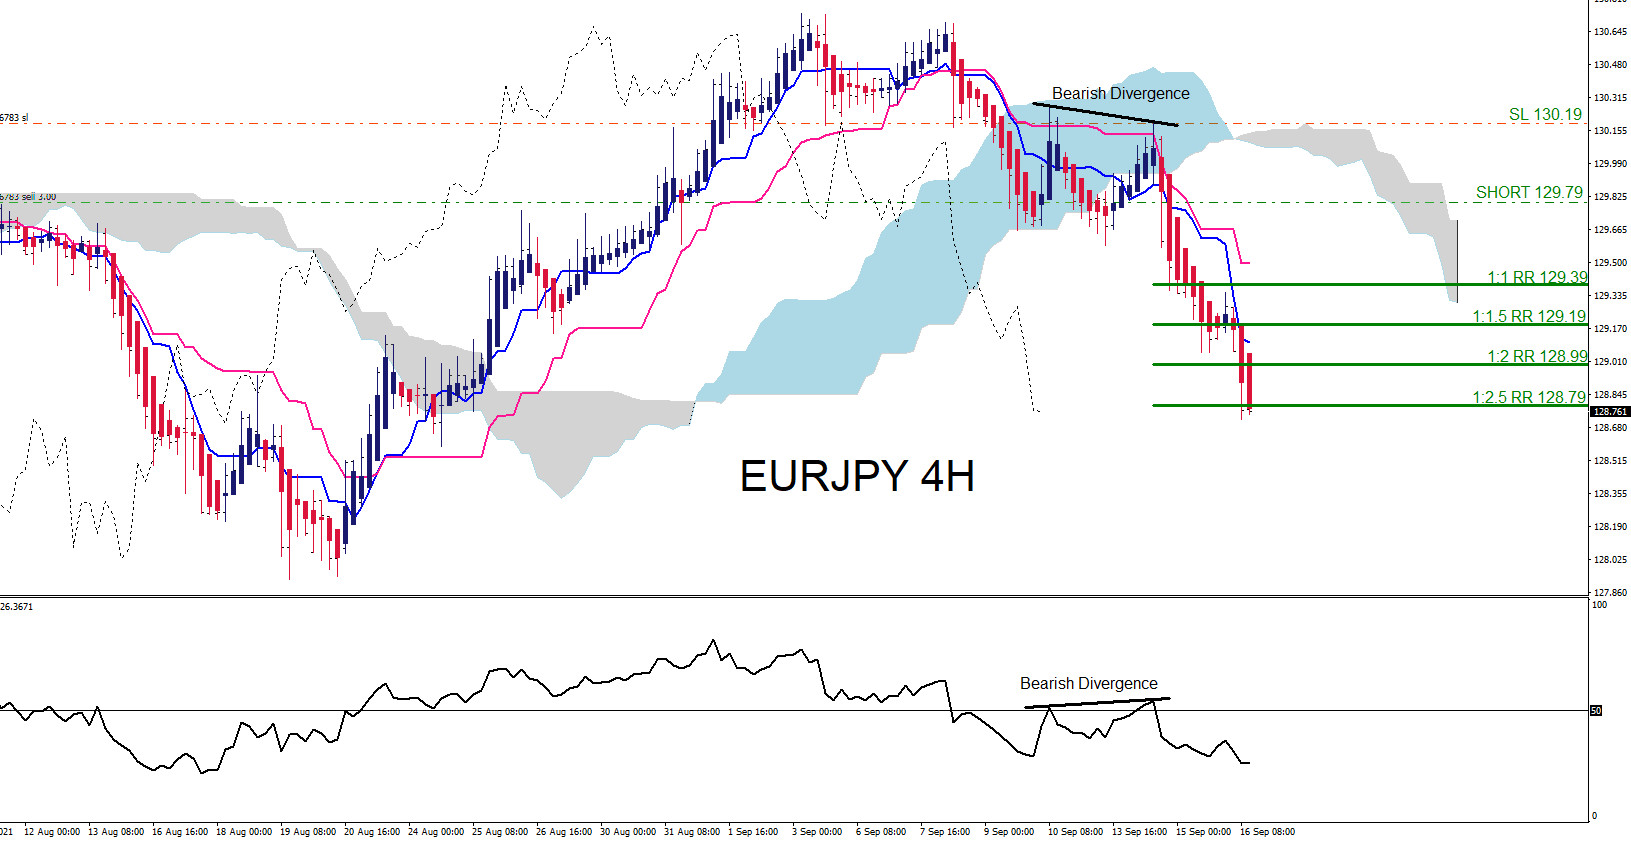
EUR/JPY eventually moved lower, and on Sept. 16, the price hit the 1:2.5 RR target at 128.79 from 121.79 for +100 pips (+2.5%). A trader should always have multiple strategies all lined up before entering a trade.
EUR/JPY Four-Hour Chart: Sept. 16, 2021
Like any strategy, there will be times when the approach fails, so proper money/risk management should always be used on every trade.



Comments
Log in or sign up to join the conversation.