

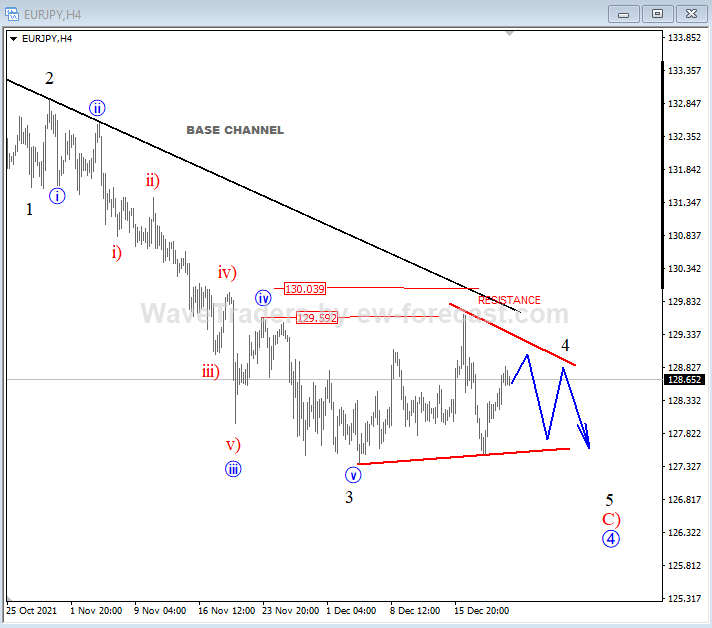
EUR/JPY is turning sharply down in the 4-hour chart again, perfectly from projected resistance after we noticed a corrective rally in wave 4.

Image Source: Pixabay
However, after recent bounce seems like EURJ/PY is forming a bearish triangle pattern, so we may see a sideways consolidation, but still be aware of a bearish continuation for the final wave 5 of C) before it finds the support.
EUR/JPY 4h Elliott Wave Analysis
(Click on image to enlarge)
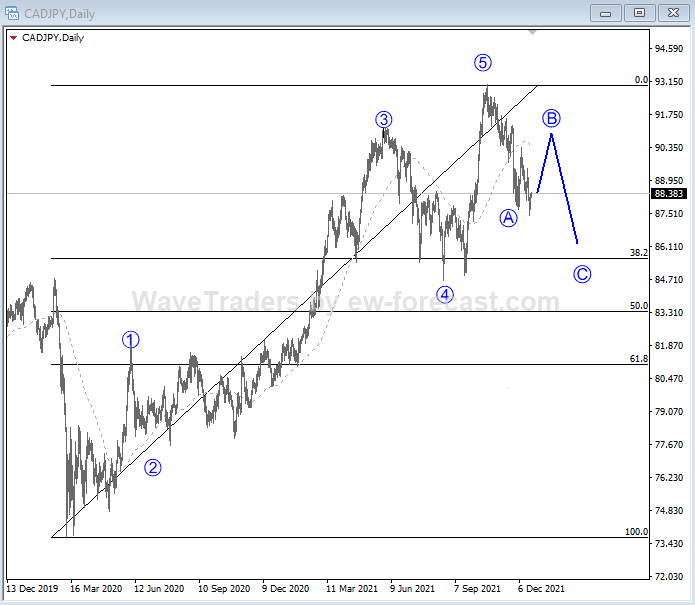
CAD/JPY is turning sharply down from the highs on a daily chart, which suggests that a five-wave cycle is completed. So, we are now tracking a three-wave A-B-C correction that can send the price at least back to 38,2% Fibonacci retracement and to the former wave 4 support. Currently seems to be wave B still in progress and once it's fully finished, be aware of another wave C decline.
CAD/JPY Daily Elliott Wave Analysis
(Click on image to enlarge)



Comments
Log in or sign up to join the conversation.