
EURCAD has been carving out higher lows along a rising trend line that’s been in place since mid-May, and the pair has recently staged an impressive surge to fresh highs near the 1.6245 area.
Price is currently hovering around 1.6220, and with the rally looking a bit stretched, a pullback to the Fibonacci retracement levels could be just what’s needed to gather fresh bullish energy for the next leg higher.
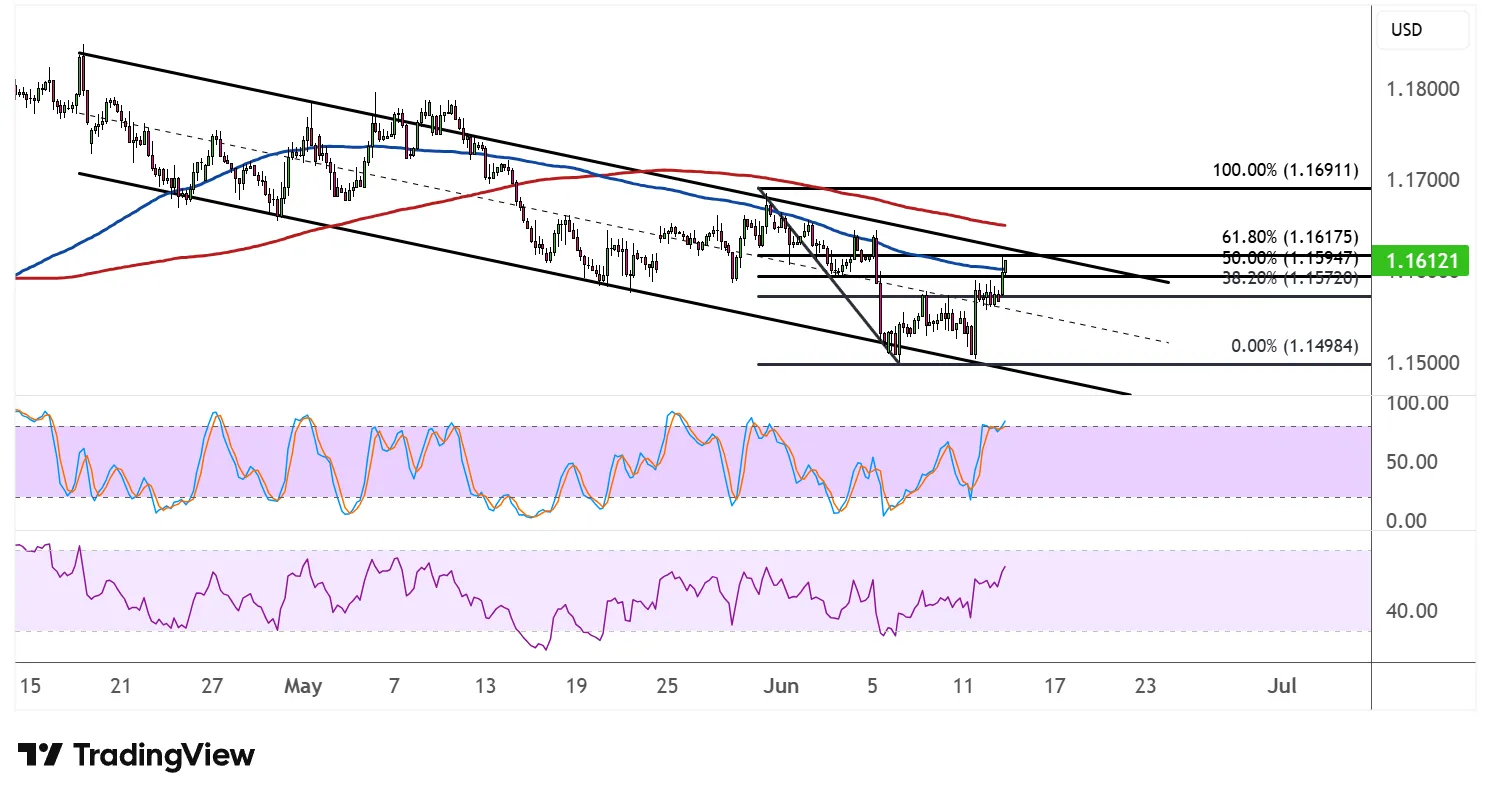
The Fibonacci retracement tool drawn from the swing low around 1.6044 up to the recent peak at 1.6245 highlights the key levels where buyers could be waiting to re-enter. The 38.2% Fib sits at 1.61685, followed by the 50% level at 1.6145.
A deeper correction could reach the 61.8% Fib at 1.6121, which lines up closely with the rising trend line and the area of interest marked by the shaded zone, making this a particularly compelling confluence zone for bulls looking for value.

On the moving average front, the 100 SMA has crossed above the 200 SMA and the gap between the two indicators is widening, confirming that the path of least resistance is to the upside and that the climb is more likely to gain traction than to reverse. Both indicators are also trending higher beneath price, so they could act as dynamic support on any dips toward the lower Fibonacci levels.
Stochastic has been cruising near the overbought region throughout much of the recent rally, reflecting strong and sustained bullish pressure. However, the oscillator appears to be curling lower, suggesting that a short-term correction could be underway to relieve the excess.
RSI, meanwhile, remains elevated but has started easing from its recent highs, leaving plenty of room to pull back before reaching oversold territory. This supports the case for a measured corrective dip rather than a full trend reversal.
If any of the Fibonacci levels manage to keep losses in check, EURCAD could resume the climb toward the swing high at 1.6245 or set its sights even higher.

Comments
Log in or sign up to join the conversation.