
The CBO has revised downward the estimate of potential GDP, implying a relatively small output gap. I wonder about the downward revision (although I have the highest regard for the estimates CBO has generated.)
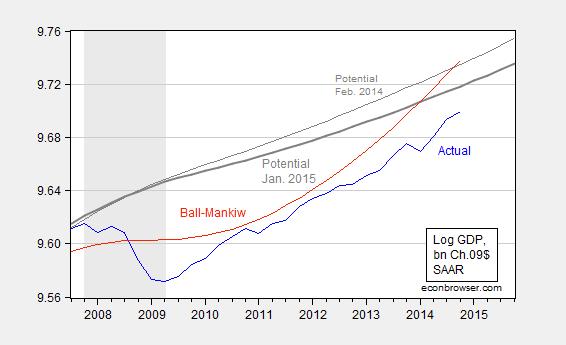
Figure 1: Log GDP (blue), potential GDP from Jan. 2015 (bold gray), potential GDP from Feb. 2014 (gray), and potential GDP as estimated using a modified Ball-Mankiw approach (red). NBER defined recession dates shaded gray. Source: BEA, 2014Q4 advance release, CBO,Budget and Economic Outlook, Jan. 2015, and Feb. 2014, NBER, and author’s calculations.
The output gap using the estimated potential from the CBO is about -1.9% (in log terms); using the estimated potential from last year’s Outlook would’ve implied a -3.5% gap. While I know the developing consensus is that the economy is approach potential, I do wonder why inflation is so low, and dropping, if we are near capacity. After all, Milton Friedman’s accelerationist hypothesis, as described in AER (1968), would suggest that the gap is widening, not shrinking.
Arguments that negative input price effects explain the decrease in inflation are fine with me. These random shocks are incorporated in the Ball-Mankiw procedure, implemented in this post. I’ve updated an implementation of this approach, setting expected inflation equal to lagged q/q PCE inflation. This yields the red line in Figure 1. The implied output gap is then -3.8%.
The qualitative aspect of the estimate is intuitive, given the trend in inflation.
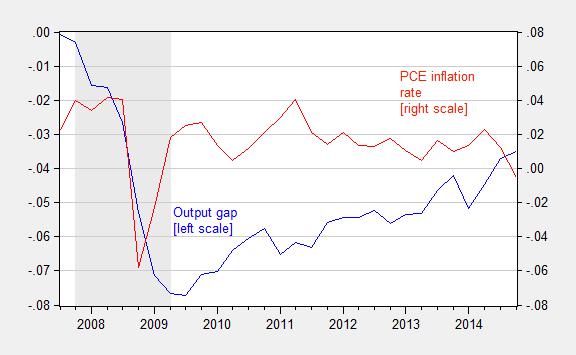
Figure 2: Log output gap as measured using the modified Ball-Mankiw procedure (blue, left scale), and q/q annualized PCE inflation (red, right scale). Source: BEA, NBER, and author’s calculations.
Now, one could take issue with the assumption of adaptive expectations, viz., πet = πt-1. If one argues expectations of PCE inflation have been anchored at 2%, one obtains an output gap of -11.4%. That outcome is driven by the plunge in PCE inflation relative to 2% shown in Figure 2.
The bottom line: The output gap can credibly be interpreted as still substantial; and given output growth in 2014Q4 seems closer to 2.1% rather than 2.6% q/q SAAR (MacroAdvisers today), perhaps the gap is not closing as fast as typically thought.
Comments
Log in or sign up to join the conversation.