
An extremely overbought equity market used a rise in interest rates post-May jobs report as an excuse to lock in gains last Friday. More unwinding probably lies ahead.
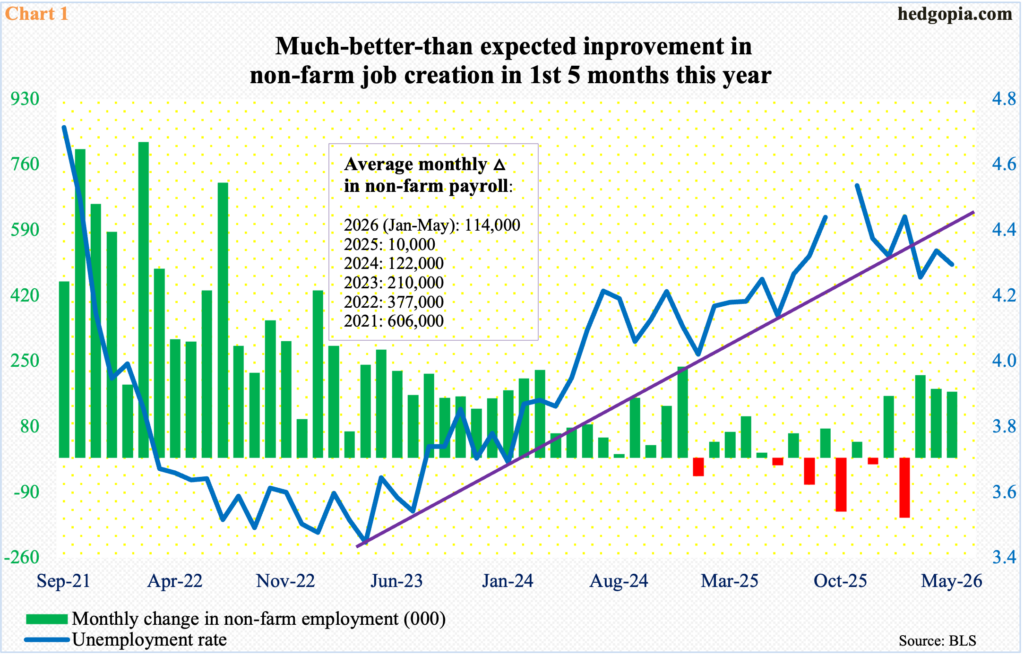
Until last Thursday, the S&P 500 was on course for a record 10th weekly gain. Then came Friday and the publication of May’s jobs report, which showed the economy added 172,000 non-farm jobs during the month. It was way more than the consensus, showing an improved labor market this year. In 2025, a monthly average of 10,000 jobs was created (Chart 1). In the first five months this year, this has improved to an average 114,000, even with February losing 156,000.
Concurrently, the unemployment rate in May came in at 4.30 percent. This is higher than the 54-year low of 3.45 percent reached in April 2023 but a rate with a four handle can hardly be labeled as alarming. A rising trendline from that low three years ago has been broken.
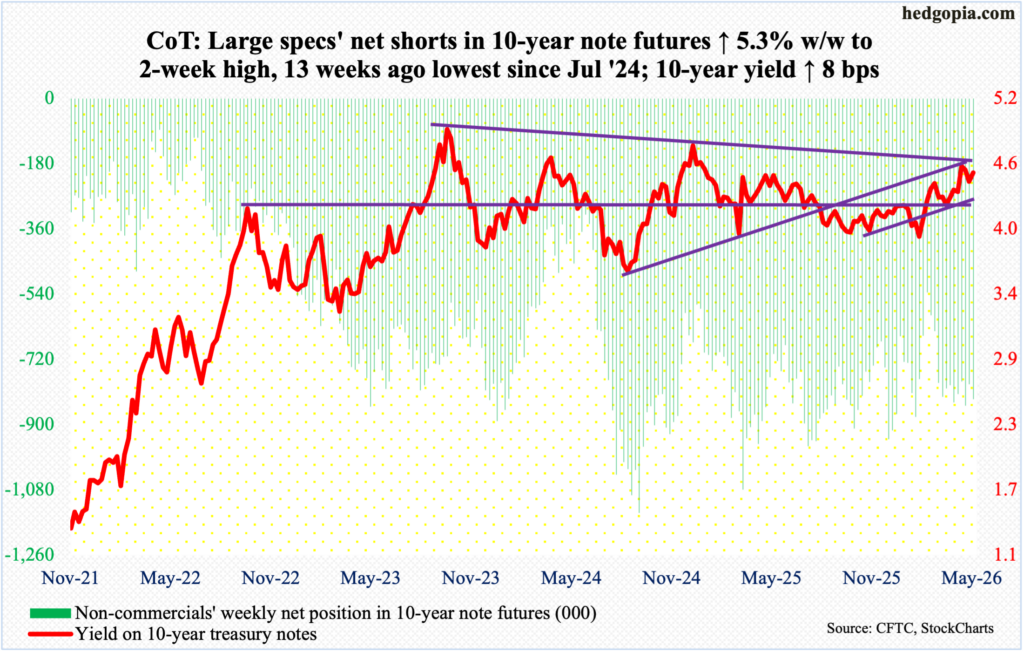
This set off alarm bells in the bond market. The 10-year yield, reversing a two-week downward trend, added eight basis points last week, six of which came on Friday, the day the jobs report came out. Earlier, on May 19, rates hit 4.69 percent and reversed lower; if that high held, the 10-year would have broken out of a falling trendline from October 2023 when rates peaked at five percent, but that was not to be. Importantly for bond bears (on price; yield and price move inverse to each other), Friday’s jump in yields followed a defense of important support at 4.20s for a couple of sessions.
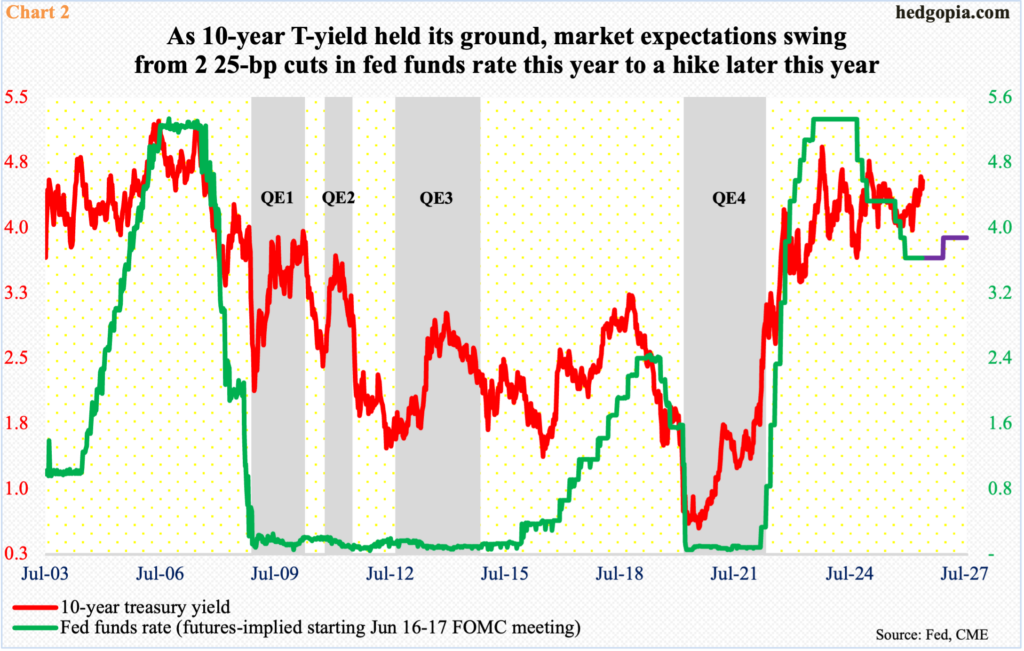
On the short end of the yield curve, things are moving even more drastically. Up until just a few months ago, fed funds futures traders were pricing in at least a couple of 25-basis-point reductions in the benchmark rates. This would have continued an easing cycle that began in September 2024. Back then, the fed funds rate reached a cycle high 525 basis points to 550 basis points in July 2023, followed by cumulative cuts of 100 basis points over three meetings in 2024. Then there were three quarter-point cuts in 2025 – one each in September, October and December – to the current 350 basis points to 375 basis points. Rates have been left unchanged this year.
Fast forward to now, market expectations have done a 360, pricing in no cut in four of the five remaining FOMC meetings this year, including this month’s (16-17), and then a hike come December (Chart 2). Should the newly appointed Chair Kevin Warsh show a soft corner for lower rates in the upcoming meeting – his first as chair – yields in the long end of the curve are likely to rebel by rallying.
Equities abhor higher rates, particularly when longs could have an itchy finger to lock in gains. Bulls are sitting on tons of paper profit.
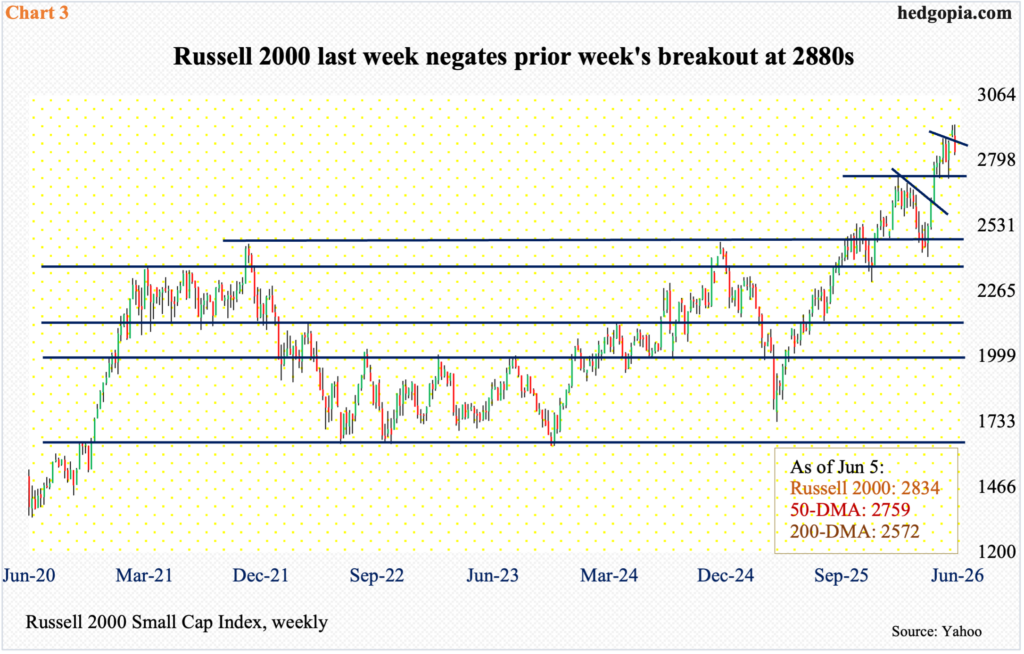
The Russell 2000 bottomed on March 30 at 2405. Last Thursday, the small cap index tagged 2944, rallying 22.4 percent in just over two months. Post-adverse reaction to Friday’s jobs report, the index closed at 2834.
Ironically, small-caps, compared with their large-cap cousins, tend to have a large exposure to the domestic economy, and they should have loved a healthy labor market. But either the Russell 2000 was singlehandedly taking a cue from the rising rates or arguably it always struggled to exhibit full-on risk-on.
Last week’s 2.9-percent drop in the Russell 2000 followed a mini breakout in the prior week at 2880s, which the bulls were unable to clear for three weeks, respectively peaking at 2879, 2888 and 2889 (Chart 3). Last Thursday’s high 2944 also barely scraped past the prior high of 2943 posted on May 28. Now that the 2880s breakout has been invalidated, the next level of major interest lies just underneath.
On January 27, the Russell 2000 peaked at 2735, before coming under pressure the next couple of months. That price point was reclaimed eight weeks ago, followed by a successful retest six and three weeks ago. Another test looks imminent, and it is a must-save for the bulls.
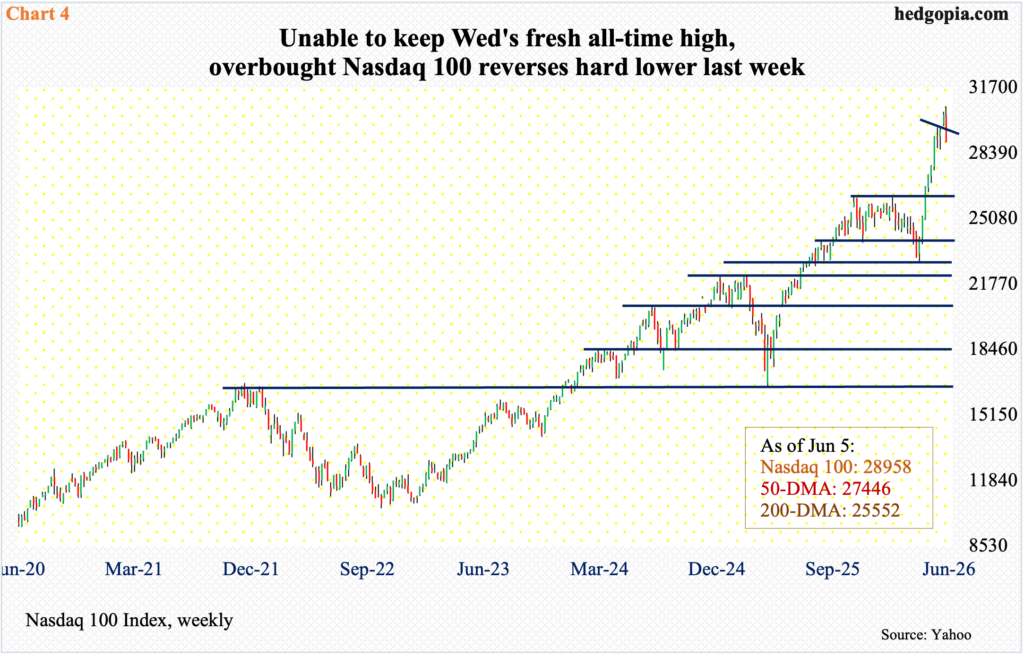
A similar must-save level awaits the Nasdaq 100 bulls at 26100s (Chart 4).
The tech-heavy index, which from the March 30 low 22841 through last Wednesday’s fresh intraday high 30762 surged 34.7 percent, gave back 4.5 percent last week to 28958. This followed a breakout invalidation in the prior week of a couple of potentially bearish weekly candles – a weekly hanging man and a spinning top before that. These candles, showing fatigue and indecision after massive gains, can create problems for the bulls in the sessions/weeks ahead.
Tech bulls are sitting on tons of paper profit and are likely to come under temptation to take gains just so they have dry powder as the IPO window opens for heavy hitters like SpaceX, which plans to go public this week, Anthropic and OpenAI, with the latter two due out in the second half.
Well before 26100s get tested, bulls’ mettle will be tested at the 50-day (27446).
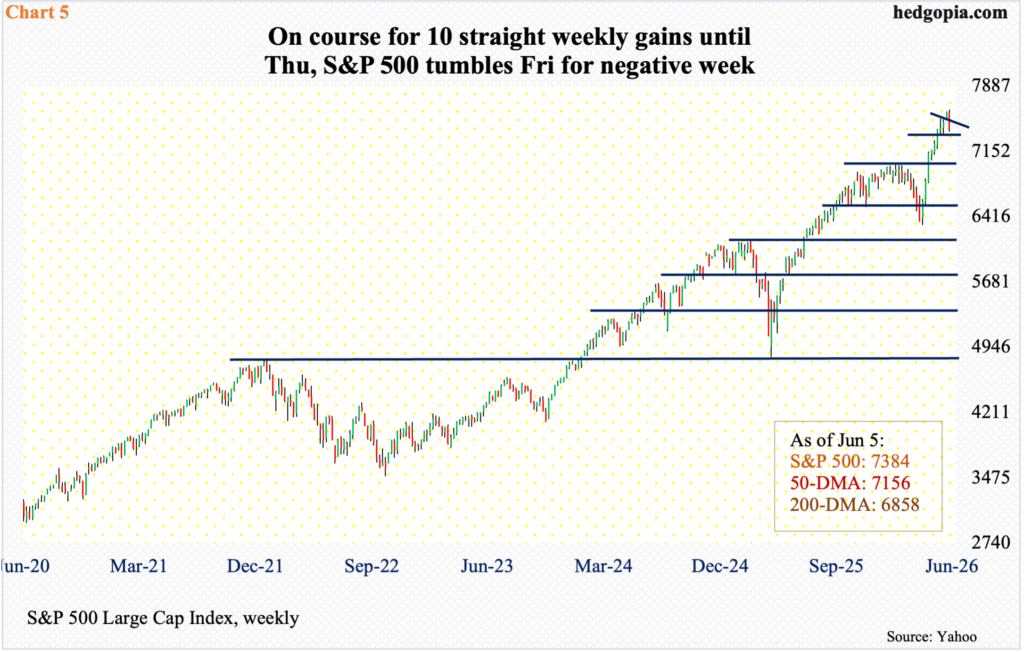
Over on the S&P 500, a major breakout retest takes place at 7000, or just underneath (Chart 5).
The large cap index finished last week down 2.6 percent to 7384, having peaked at a fresh all-time high 7621 which was hit last Tuesday. From March 30 when it bottomed at 6317 through last week’s high, the S&P 500 rose 20.6 percent.
Leading into last week, the index had already rallied for nine consecutive weeks from the March low and was on its way to making it a record 10th until Thursday; Friday’s 2.6-percent tumble denied the bulls of that feat.
Before bulls and bears fight over control of 7000, they are likely to lock horns at the 50-day (7156), which also lines up with straight-line support at 7140s. Immediately ahead, there is minor support at 7330s, and then 7270s.
Comments
Log in or sign up to join the conversation.