


Estimates for 2026Q2, Q3, compared to 2000.
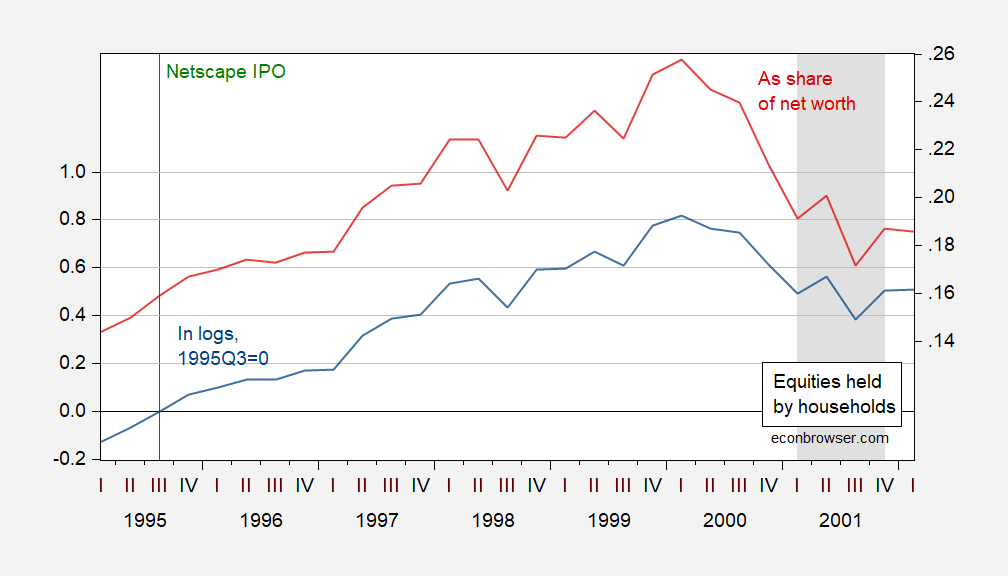
Figure 1: PCE deflated equities and mutual funds held by households, in logs 1995Q3=0 (blue, left scale), equities and mutual funds held by households as a share of net worth (red, right scale). NBER defined peak-to-trough recession dates shaded gray. Source: Board of Governors of Federal Reserve, Flow of Funds, BEA, NBER and author’s calculations.
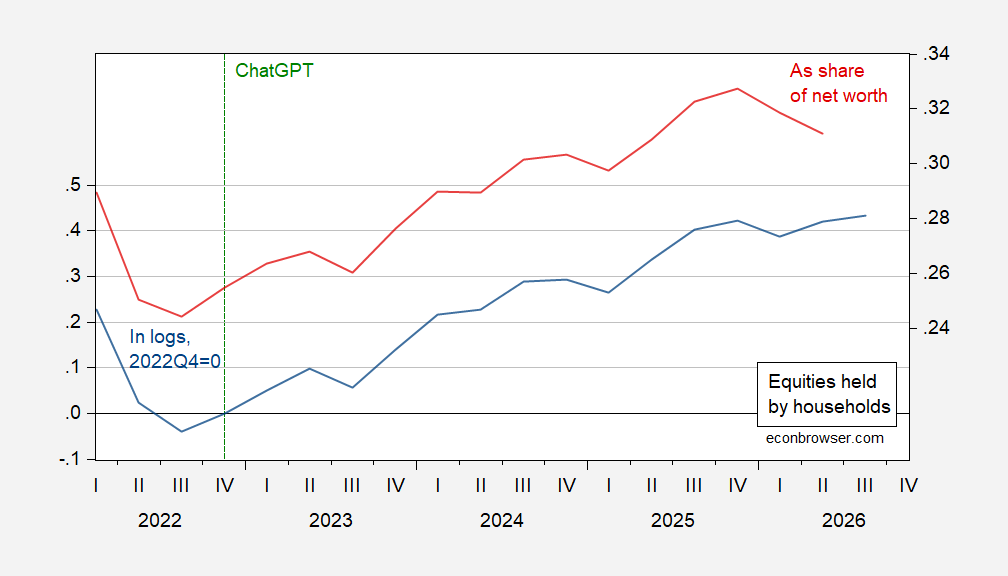
Figure 2: PCE deflated equities and mutual funds held by households, in logs 1995Q3=0 (blue, left scale), equities and mutual funds held by households as a share of net worth (red, right scale). 2026Q2 and Q3 equity holdings estimated from first log differences regression holdings on SP500 value, 2022-2026. Source: Board of Governors of Federal Reserve, Flow of Funds, BEA, NBER and author’s calculations.
Equity holdings have risen by less so far (a bit over 40% compared to 60% to peak in 2000), while the share of household net worth is right now higher (31% vs. 26% in 2000). What would be the impact on consumption? It used to be that analysts would distinguish between paper and real wealth (real estate, etc.). Beach, Gamber and Moran (2025) note the decline in the MPC out of wealth can be explained by increasing wealth heterogeneity/concentration. They estimate the MPC in 2000 was about 3.4 cents on the dollar, while that as of 2019 was about 2.6 cents on the dollar.
A $3 trillion reduction in wealth — about that experienced last week — would then amount to an $80 billion reduction in consumption. Q3 nominal consumption was at at about $22.5 trillion (SAAR), so this is a small reduction in and of itself. However, were the trend to shift along with a one-time drop, then the reduction in consumption would be much more noticeable.


Comments
Log in or sign up to join the conversation.