
The employment release for October provided lots of interesting facts. First employment growth is faster than anticipated, and the second, it was faster in September than originally estimated.
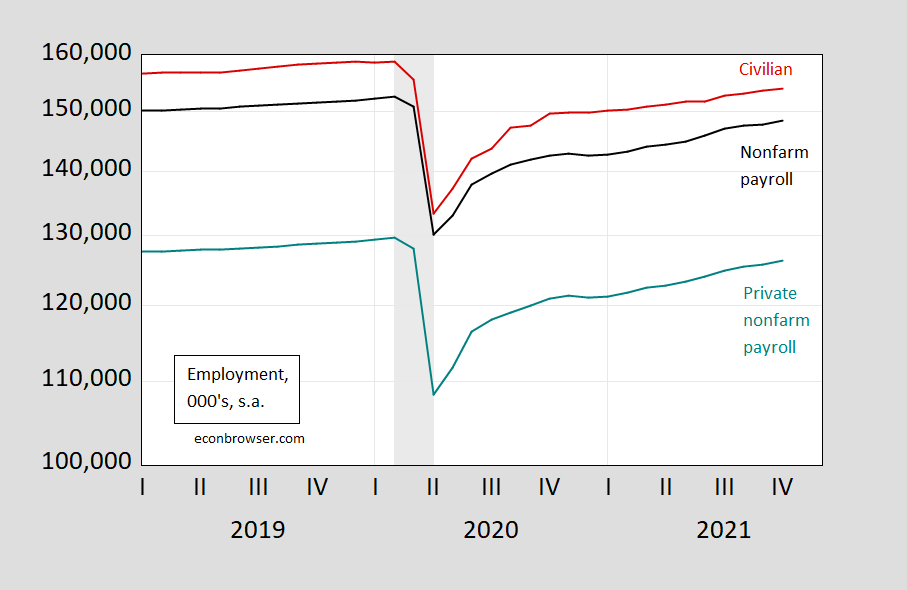
Figure 1: Nonfarm payroll employment (black), private nonfarm payroll employment (teal), civilian employment (red), all in 000’s, s.a. NBER defined recession dates shaded gray. Source: BLS, NBER.
The originally lackluster September numbers were upwardly revised substantially. This is a pattern that’s occurred over the past five months, although less significantly so in the previous instances.
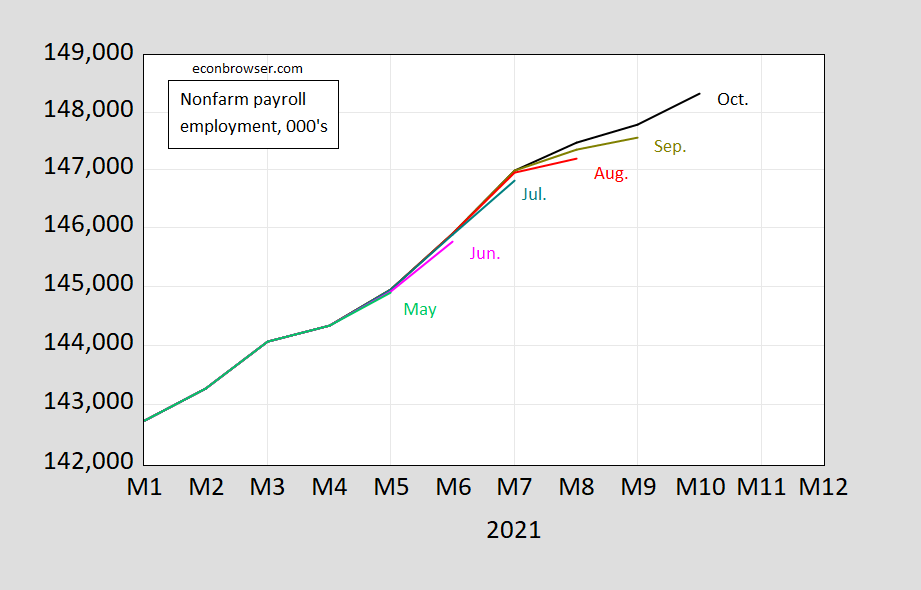
Figure 2: Nonfarm payroll employment in October (black), in September (chartreuse), August (red), July (teal), June (pink), May (light green), all in 000’s, s.a.Source: BLS.
This serves as a reminder that the first read of the employment figures are an estimate. The mean absolute revision in the monthly changes between first and second estimate is 48 (in thousands), and between first and third is 61 (full results at BLS).
Note that growth in high contact services roughly doubled in pace going from August to October, which has been attributed to the waning of the impact of the Delta surge. There was an acceleration in manufacturing, but much less pronounced.
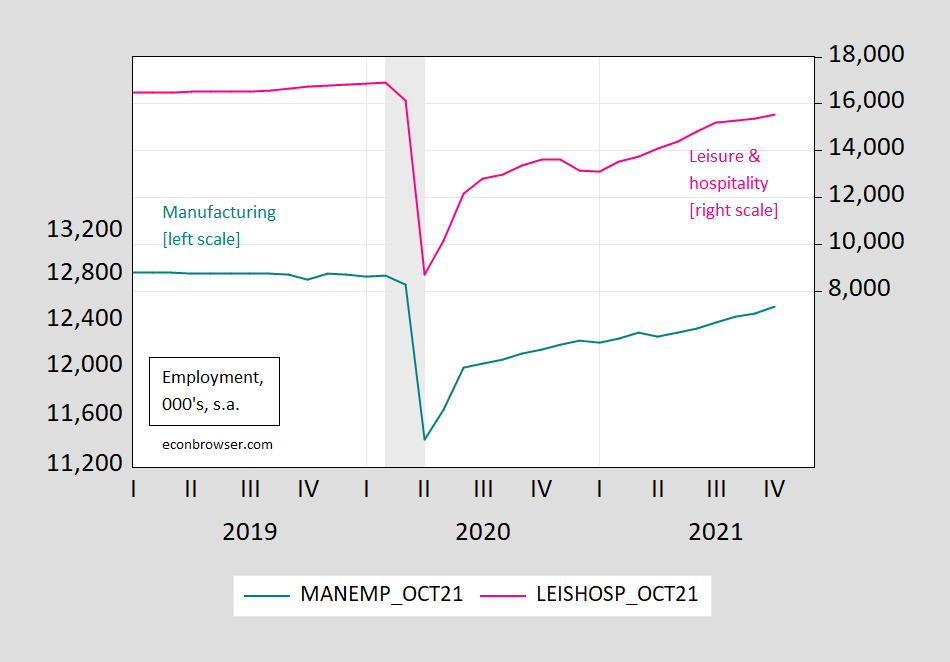
Figure 3: Manufacturing employment (teal, left log scale), leisure and hospitality employment (pink, right log scale), all in 000’s, s.a. NBER defined recession dates shaded gray. Source: BLS, NBER.
Finally, while there are worries about inflation eroding wage gains, it’s important to note that average real (CPI deflated) wages are higher than they were at the outset of the pandemic, for the entire private sector, for manufacturing. And for leisure and hospitality, real wages are far above what they were pre-pandemic, and still rising smartly.
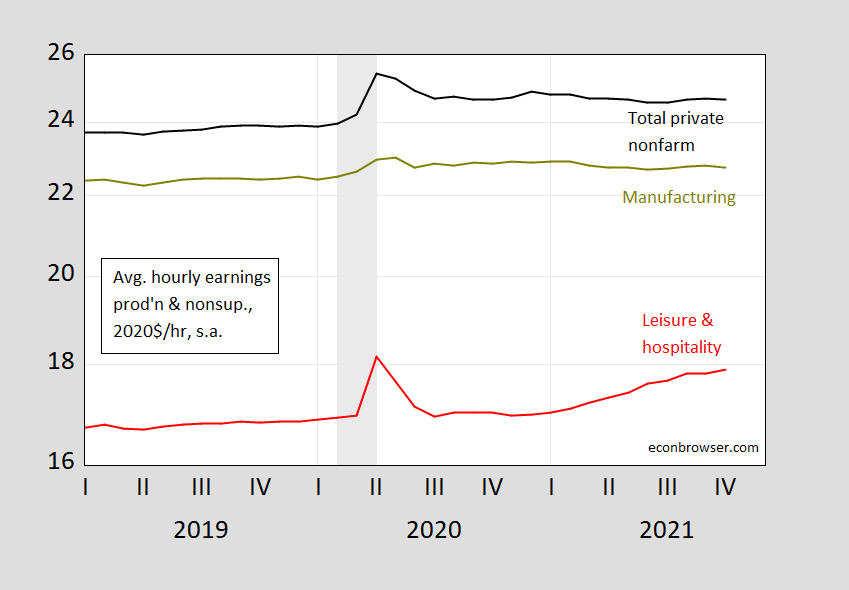
Figure 4: Nonfarm payroll production and nonsupervisory average hourly earnings (black), manufacturing(chartreuse), leisure and hospitality (red), all in 2020$, s.a. (CPI deflated).October observation for earnings uses nowcasted CPI as of 11/5. NBER defined recession dates shaded gray. Source: BLS, Cleveland Fed, NBER, and author’s calculations.
If one is concerned with the real income of those at the lowest end of the pay spectrum — say in leisure and hospitality –, one should be happy to see this latter trend (5.6% y/y, 5.0% m/m AR, using nowcasted October CPI).
A final snapshot of the private sector employment, hours, and real wages:
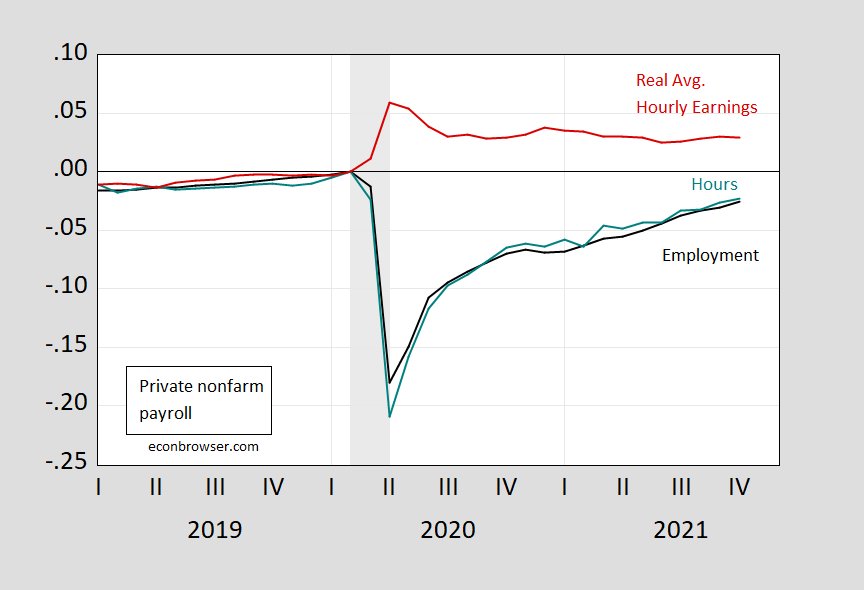
Figure 5: Private nonfarm payroll employment (black), aggregate hours for production and nonsupervisory workers (teal), real average hourly earnings in 2020$/hr (red), all s.a. October observation for earnings uses nowcasted CPI as of 11/5. NBER defined recession dates shaded gray. Source: BLS, NBER, Cleveland Fed, and author’s calculations.


Comments
Log in or sign up to join the conversation.