

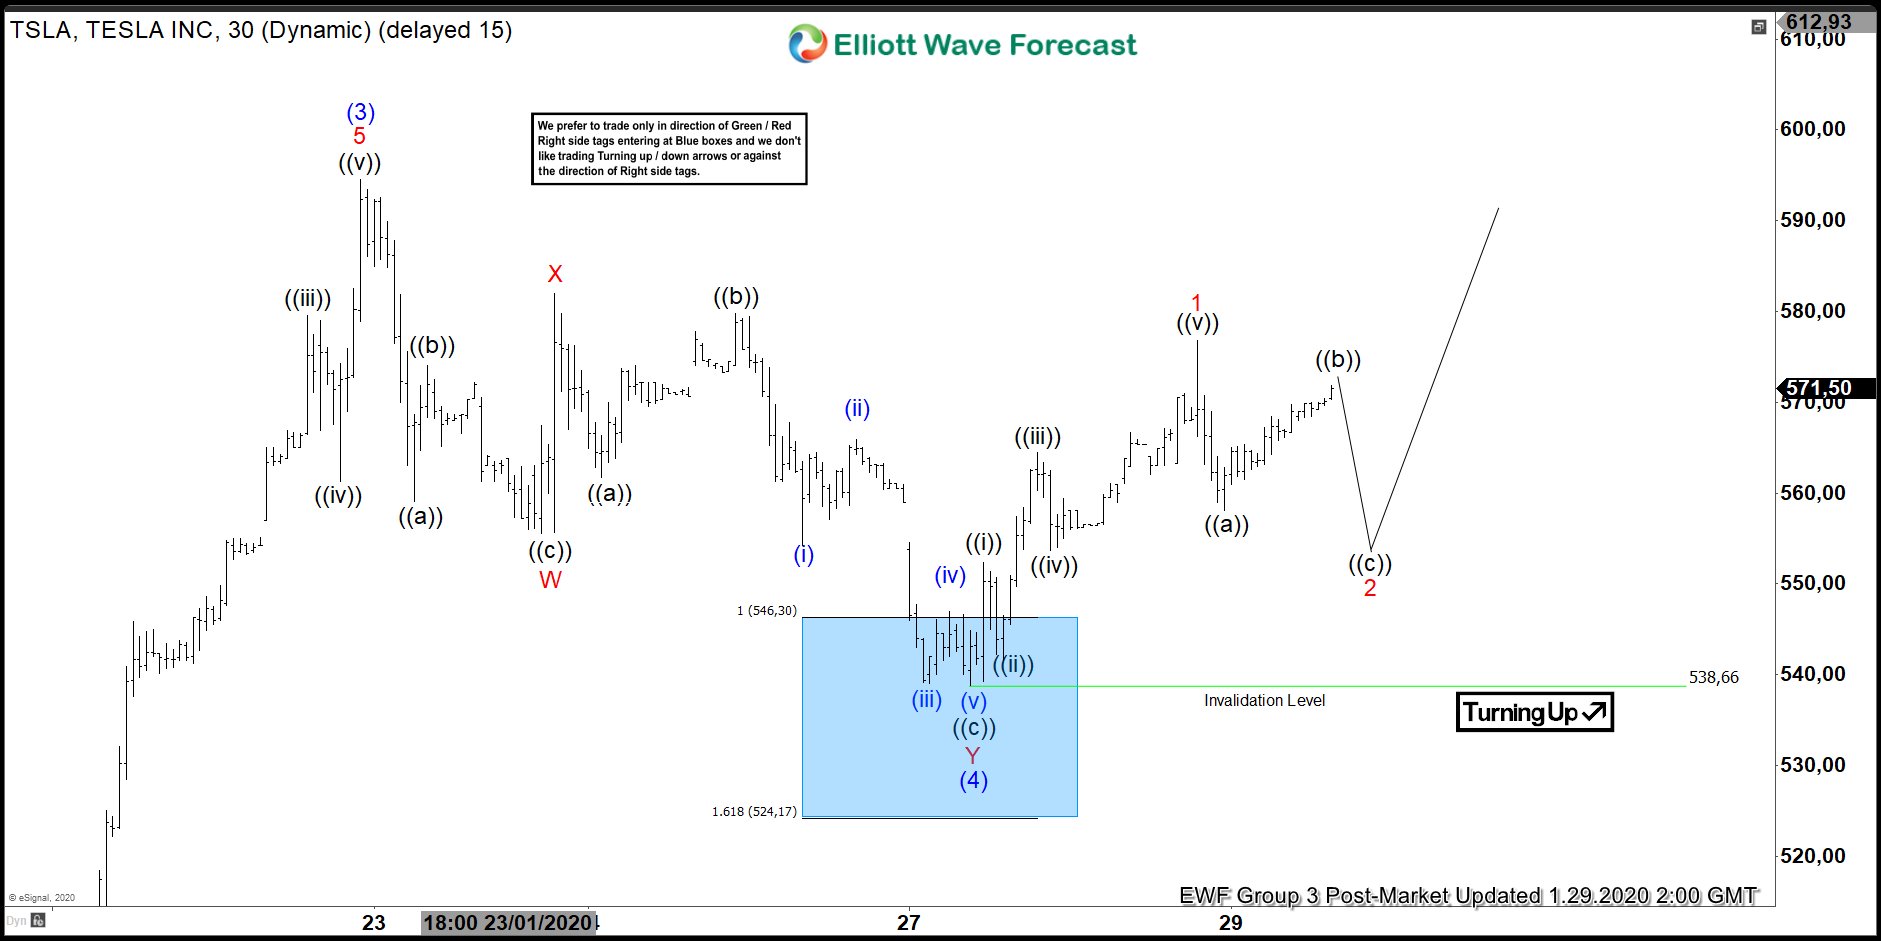
Short term Elliott wave view in Tesla (ticker: TSLA) suggests the rally to $594.5 ended wave (3). The stock then corrected in wave (4) and the pullback ended at $538.66. The structure of wave (4) unfolded as a double three Elliott Wave structure. Down from 594.5, wave W ended at 555.55 as a zigzag where wave ((a)) of W ended at 559.1, wave ((b)) of W ended at 574, and wave ((c)) of W ended at 555.55.
Wave X bounce ended at 582 and wave Y of (4) ended at 538.66. Structure of wave Y unfolded also as a zigzag where wave ((a)) of Y ended at 561.76, wave ((b)) of Y ended at 579.8, and wave ((c)) of Y ended at 538.66. Tesla has resumed higher in wave (5) with the internal unfolding as an impulsive structure. Up from 538.66, wave 1 of (5) ended at 576.81. While wave 2 pullback stays above 538.66 in the first degree, expect the stock to extend higher. If the stock breaks below 538.66, then it's doing a double correction and buyers should appear at the next 100% - 123.6% extreme area in 7 swing.
Tesla (TSLA) 1 Hour Elliott Wave Chart



Comments
Log in or sign up to join the conversation.