

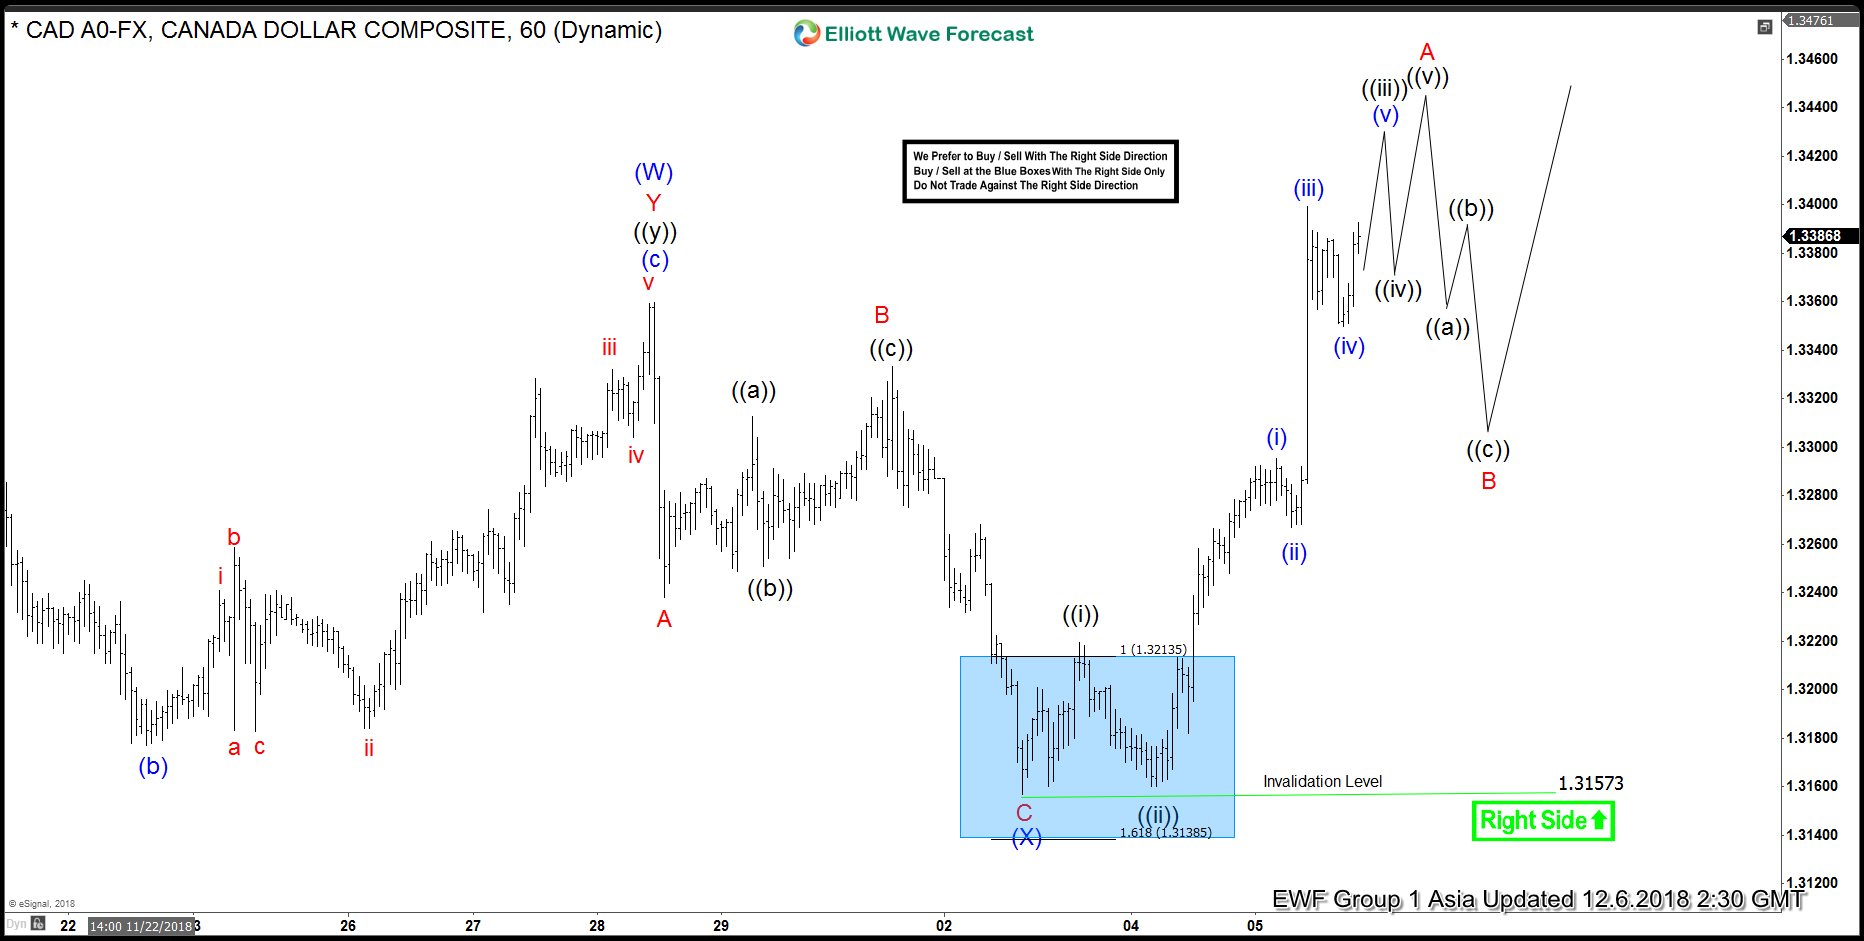
USDCAD has broken above 11/29/2018 high (1.336) as well as above 6/27/2018 high (1.3386) creating incomplete bullish sequence. Short term Elliott Wave view suggests the rally to 1.336 on 11/29 ended Intermediate wave (W) and the pullback to 1.3157 ended Intermediate wave (X). Internal of Intermediate wave (X) unfolded as a zigzag Elliott Wave structure where Minor wave A ended at 1.324. Minor wave B bounce ended at 1.333, and Minor wave C of (X) ended at 1.3157 low.
Up from 1.3157, pair has made a new high above Intermediate wave (W) at 1.3157, suggesting the next leg higher has started. The rally is unfolding as a 5 waves impulse Elliott Wave structure where Minute wave ((i)) ended at 1.322 and Minute wave ((ii)) ended at 1.316. Expect pair to do 1 more leg higher to end the 5 waves impulse and complete Minor wave A of larger degree. Pair should then pullback in Minor wave B to correct cycle from 12/3/2018 low in 3-7-11 swing before the rally resumes.
USDCAD 1 Hour Elliott Wave Chart
 v
v



Comments
Log in or sign up to join the conversation.