

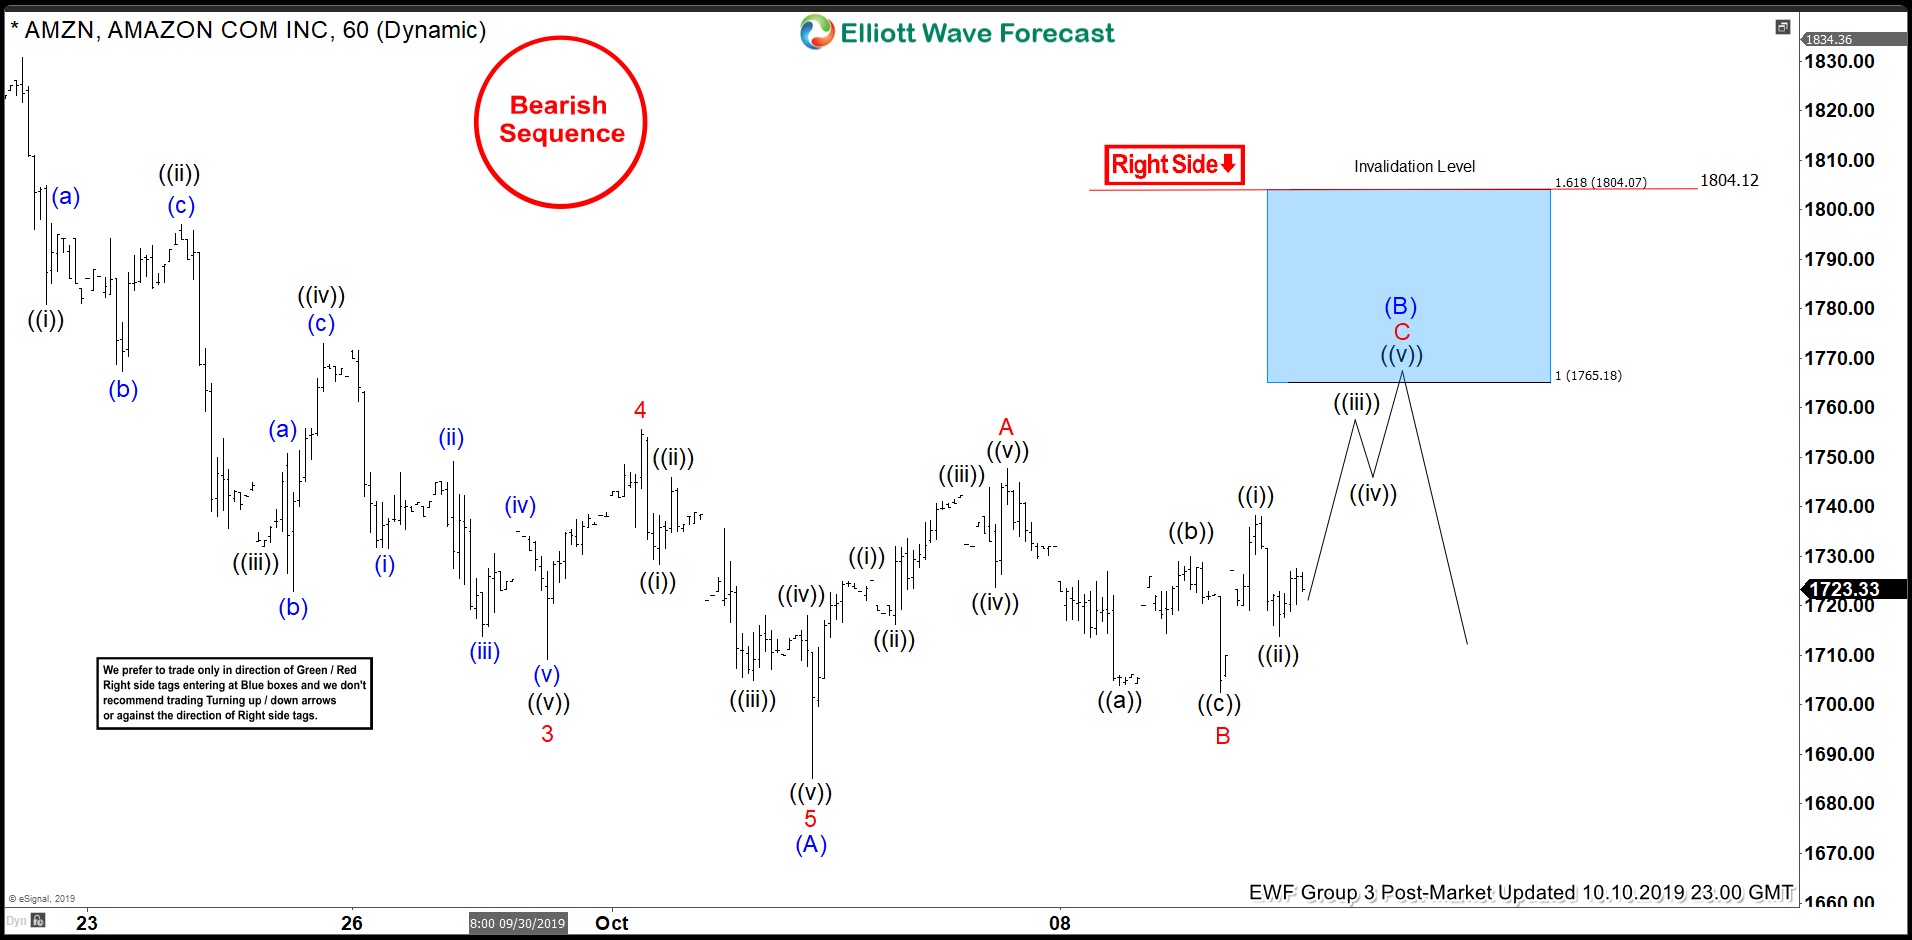
Short term Elliott Wave view of Amazon ($AMZN) suggests the decline to 1685.06 ended wave (A). Internal of wave (A) unfolded as a 5 waves impulse Elliott Wave structure. On the chart below, we can see wave 3 of (A) ended at 1709.22, wave 4 of (A) ended at 1755.6, and wave 5 of (A) ended at 1685.06. Wave (B) bounce is currently in progress to correct cycle from September 12, 2019 before the decline resumes.
Internal of wave (B) is unfolding as a zigzag Elliott Wave structure. Up from 1685.06, wave A ended at 1747.83 as a 5 waves impulse of lesser degree. Stock then pullback in wave B and ended the pullback at 1702.50. Expect stock to extend higher in wave C of (B) towards 1765.18 - 1804.12 area before stock resumes the decline lower or pullback in 3 waves at least. Potential target to the downside is 100% Fibonacci extension from July 11, 2019 high which comes at 1462 - 1536.
AMZN 1 Hour Elliott Wave Chart



Comments
Log in or sign up to join the conversation.