

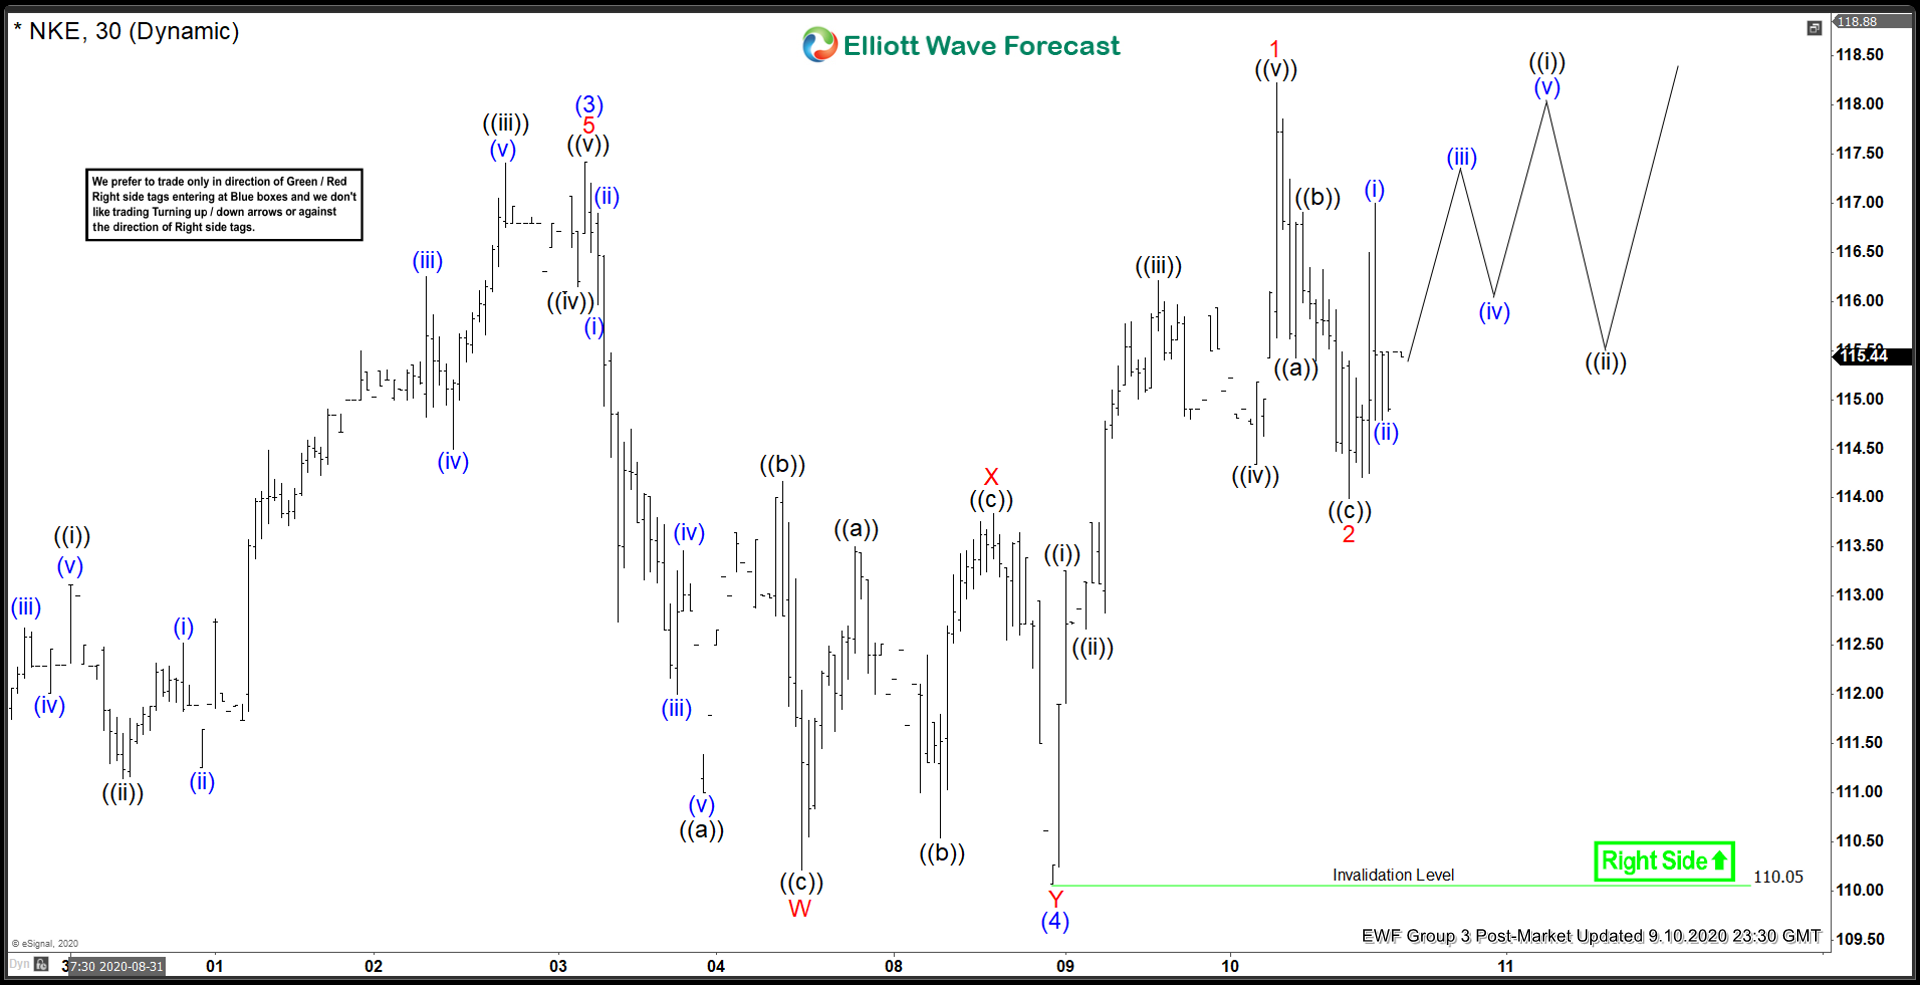
Nike (NKE) has made another all-time high suggesting the bulls remain in firmly in control. Elliott Wave View of Nike suggests the stock is still within the cycle from March low as an impulse. Currently, the stock is within wave (5) from March low. The rally from March Covid-19 low to $117.42 ended wave (3). Pullback in wave (4) completed at $110.05 as a double three correction. Down from wave (3) at $117.42, wave W ended at $110.21, wave X ended at $113.84, and wave Y of (4) ended at $110.05.
Wave (5) rally is now in progress as an impulse Elliott Wave structure. Up from wave (4) low at $110.05, wave ((i)) ended at $113.26 and wave ((ii)) pullback ended at $112.66. The stock then resumed higher in wave ((iii)) towards $116.21, wave ((iv)) pullback ended at $114.34, and the final wave ((v)) ended at $118.23. This also ended wave 1 of (5) in higher degree. Pullback in wave 2 is proposed complete at $114 as a zigzag. Down from red 1 at $118.23, wave ((a)) ended at $115.43, wave ((b)) ended at $116.91, and wave ((c)) of 2 ended at $114. Near term, Nike still needs to break above wave 1 at $118.23 to avoid a double correction in wave 2. As far as pullback stays above $110.05, expect the stock to find support in 3, 7, or 11 swing for new all-time high.
Nike (NKE) 30 Minutes Elliott Wave Chart



Comments
Log in or sign up to join the conversation.