

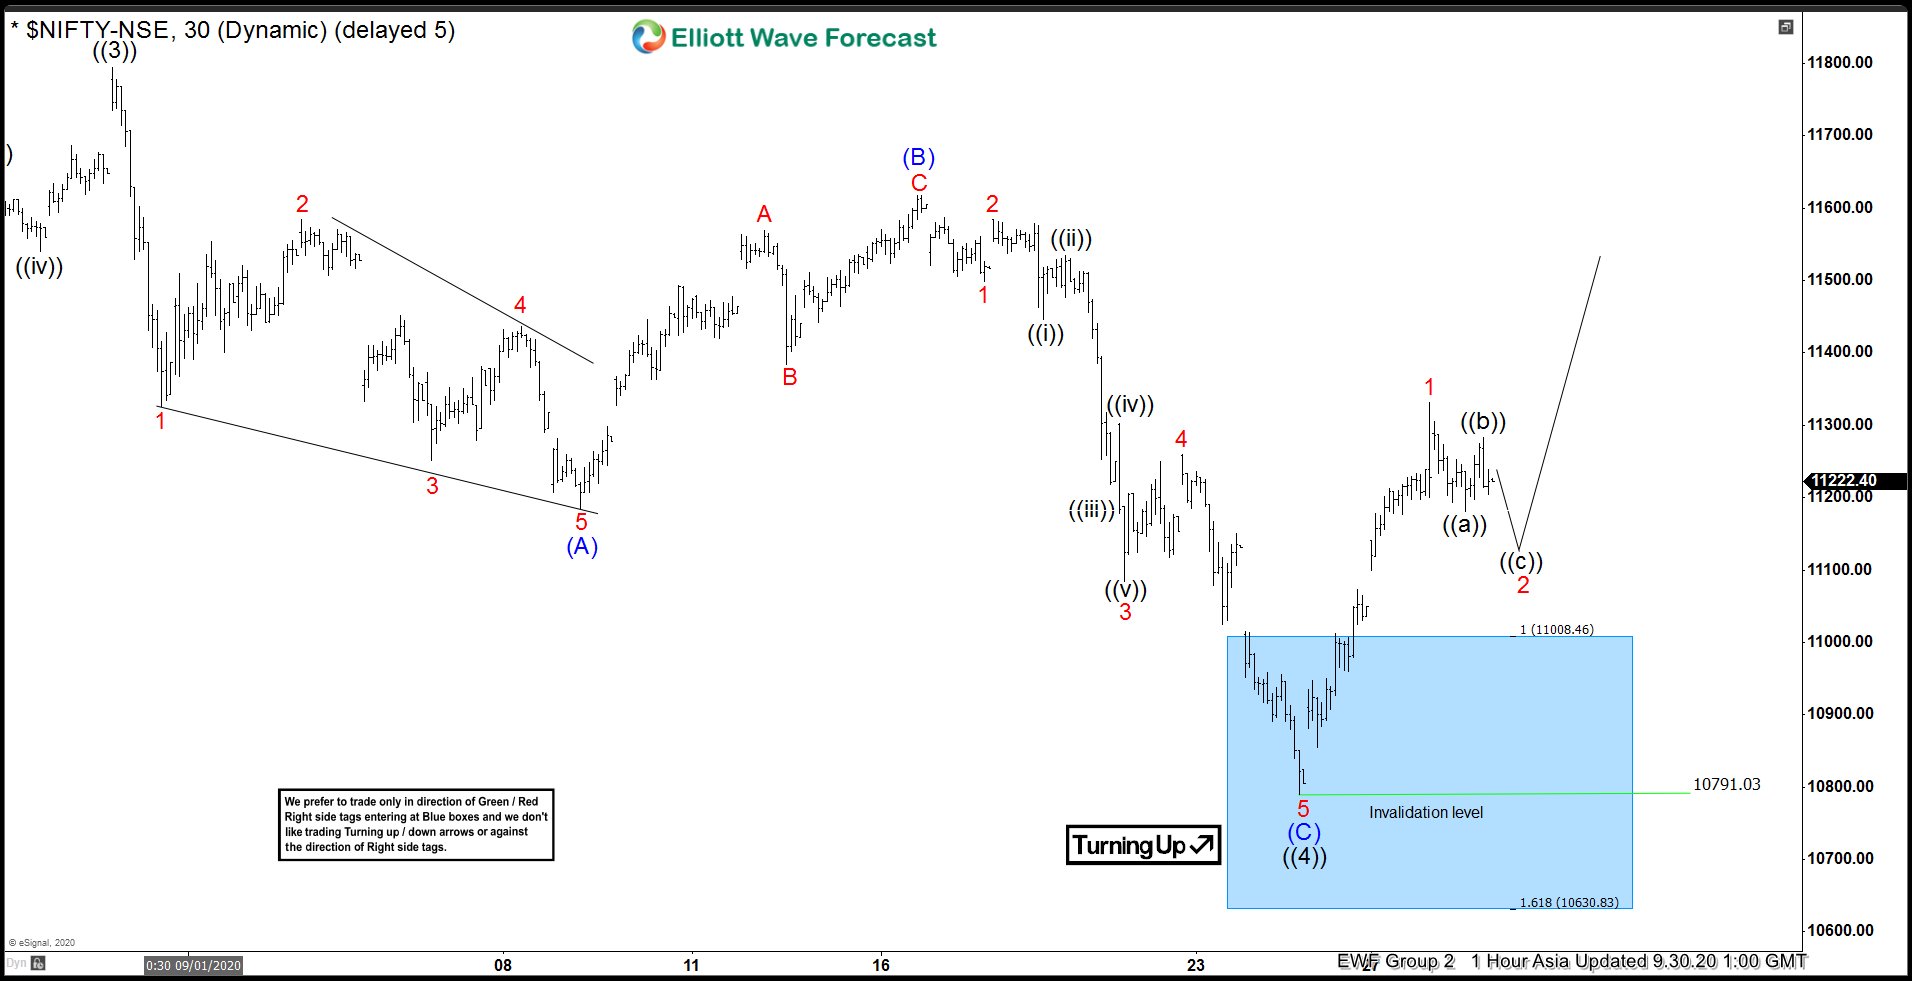
Elliott Wave view of Nifty suggests the cycle from March 24 low still remains in progress as a 5 waves impulse. The 30 minutes chart below shows the rally to 11794.25 ended wave ((3)) of this impulse from March low. Pullback to 10791.03 ended wave ((4)) as a zigzag Elliott Wave structure. Down from wave ((3)) high at 11794.25, wave 1 ended at 11325.85 and wave 2 bounce ended at 11584.95. Wave 3 then resumed lower to 11251.70, wave 4 ended at 11429.55, and wave 5 ended at 11185.15. This ended wave (A) of the zigzag in higher degree.
Wave (B) bounce ended at 11618.10 as a zigzag in lesser degree where wave A ended at 11568.9, wave B ended at 11383.55, and wave C ended at 11618.10. Index then resumed lower in wave (C) towards 10791.03 with subdivision as a 5 waves impulse. Down from wave (B) high at 11618.10, wave 1 ended at 11498.50, wave 2 ended at 11584.10, wave 3 ended at 11084.65, wave 4 ended at 11259.55, and wave 5 ended at 10791.03. This ended wave (C) of ((4)) in higher degree. Index has since turned higher from the blue box area. Up from 10791.03, wave 1 ended at 11239.35. Near term, pullback in wave 2 is expected to find support in 3, 7, or 11 swing against 10791.03 low for further upside.
Nifty 30 Minutes Elliott Wave Chart



Comments
Log in or sign up to join the conversation.