

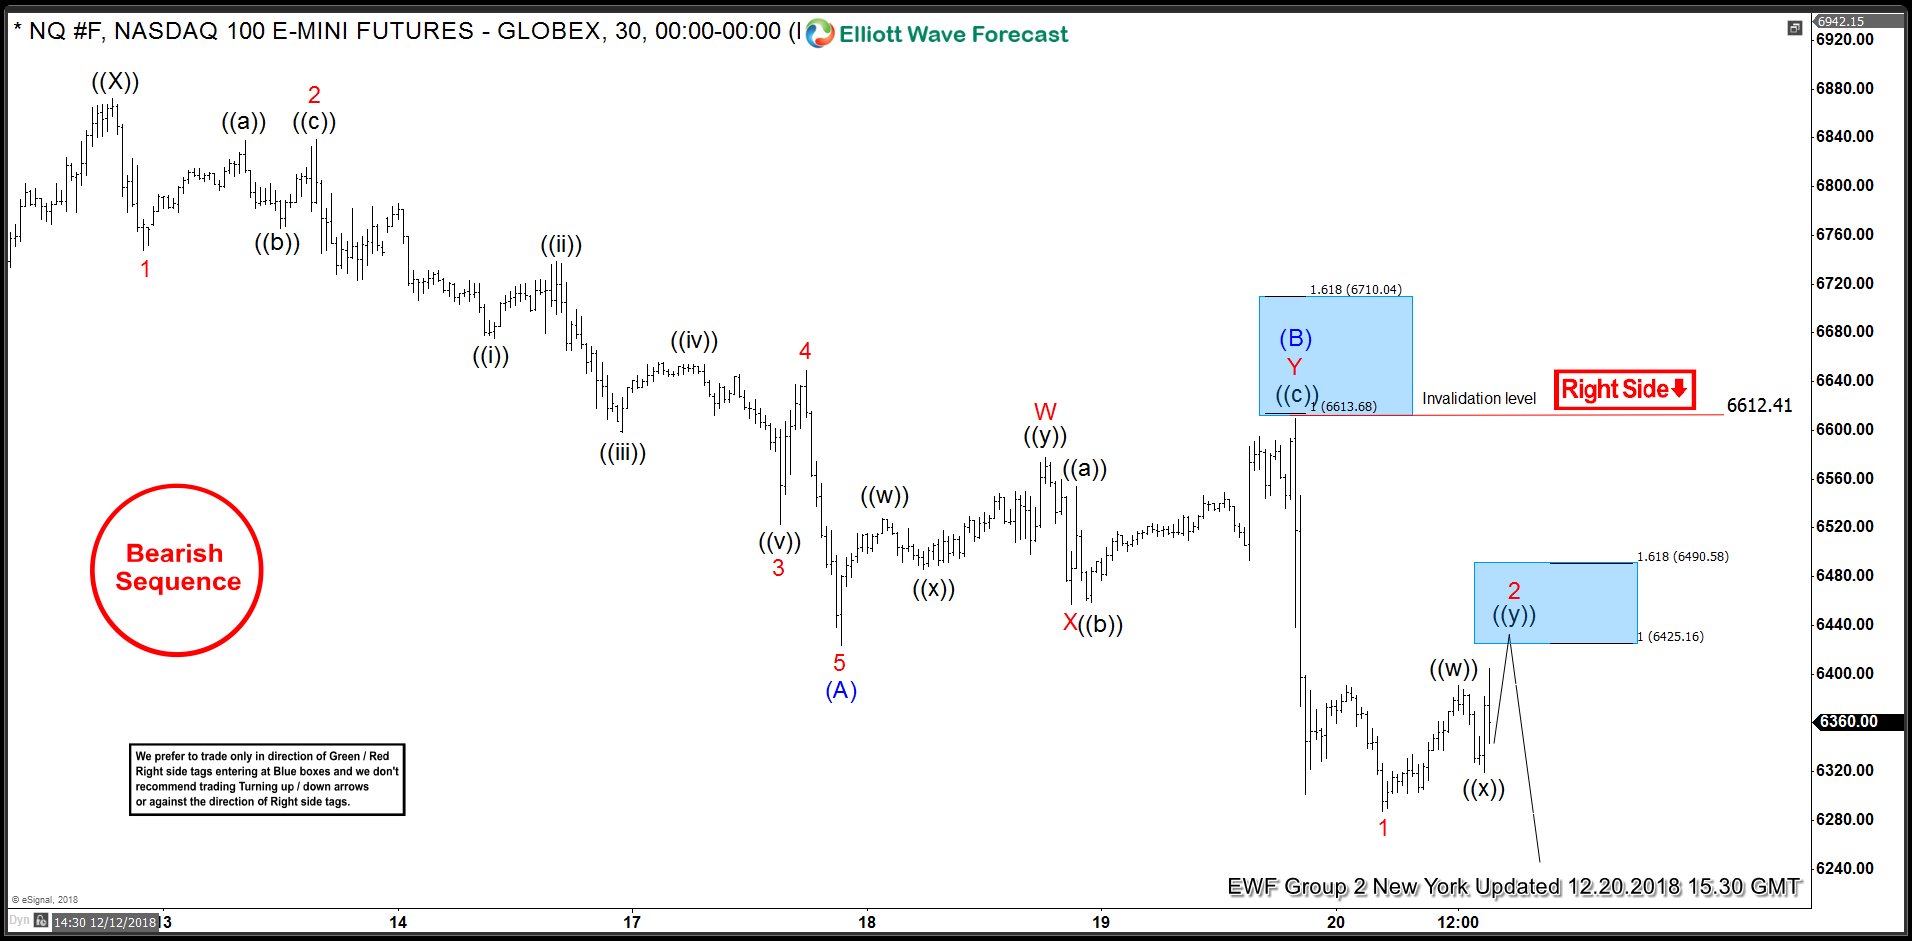
NASDAQ ticker symbol: $NQ_F short-term Elliott wave view suggests that a bounce to $6897 high ended Primary wave ((X)). Down from there, the decline is unfolding as a zigzag structure within primary wave ((Y)) where an initial decline to $6772.25 low ended Minor wave 1. Minor wave 2 bounce ended at $6864.75 high, Minor wave 3 ended in lesser degree 5 waves at $6523 low. Then a bounce to $6649 high ended Minor wave 4. Finally a push lower to $6423.25 low ended Minor wave 5 & also completed the intermediate wave (A) in 5 wave impulse structure.
Above from there, the index made a 3 wave bounce higher & completed the intermediate wave (B) at $6612.41 high. The internals of that bounce unfolded as double three structure where Minor wave W ended at $6577.50 high. Minor wave X ended at $6457 low and Minor wave Y ended $6612.41 high. Down from there, the index has made a new low below $6423.25 low confirming the intermediate wave (C) lower. Also, with this break lower the cycle from 12/12 peak ($6897) has become incomplete to the downside favoring more downside. Near-term, while bounces fail below $6612.41 high expect index to extend lower. We expect bounces to get failed against $6612.41 high in 3, 7 or 11 swings for further downside.
NASDAQ 1 Hour Elliott Wave Chart




Comments
Log in or sign up to join the conversation.