

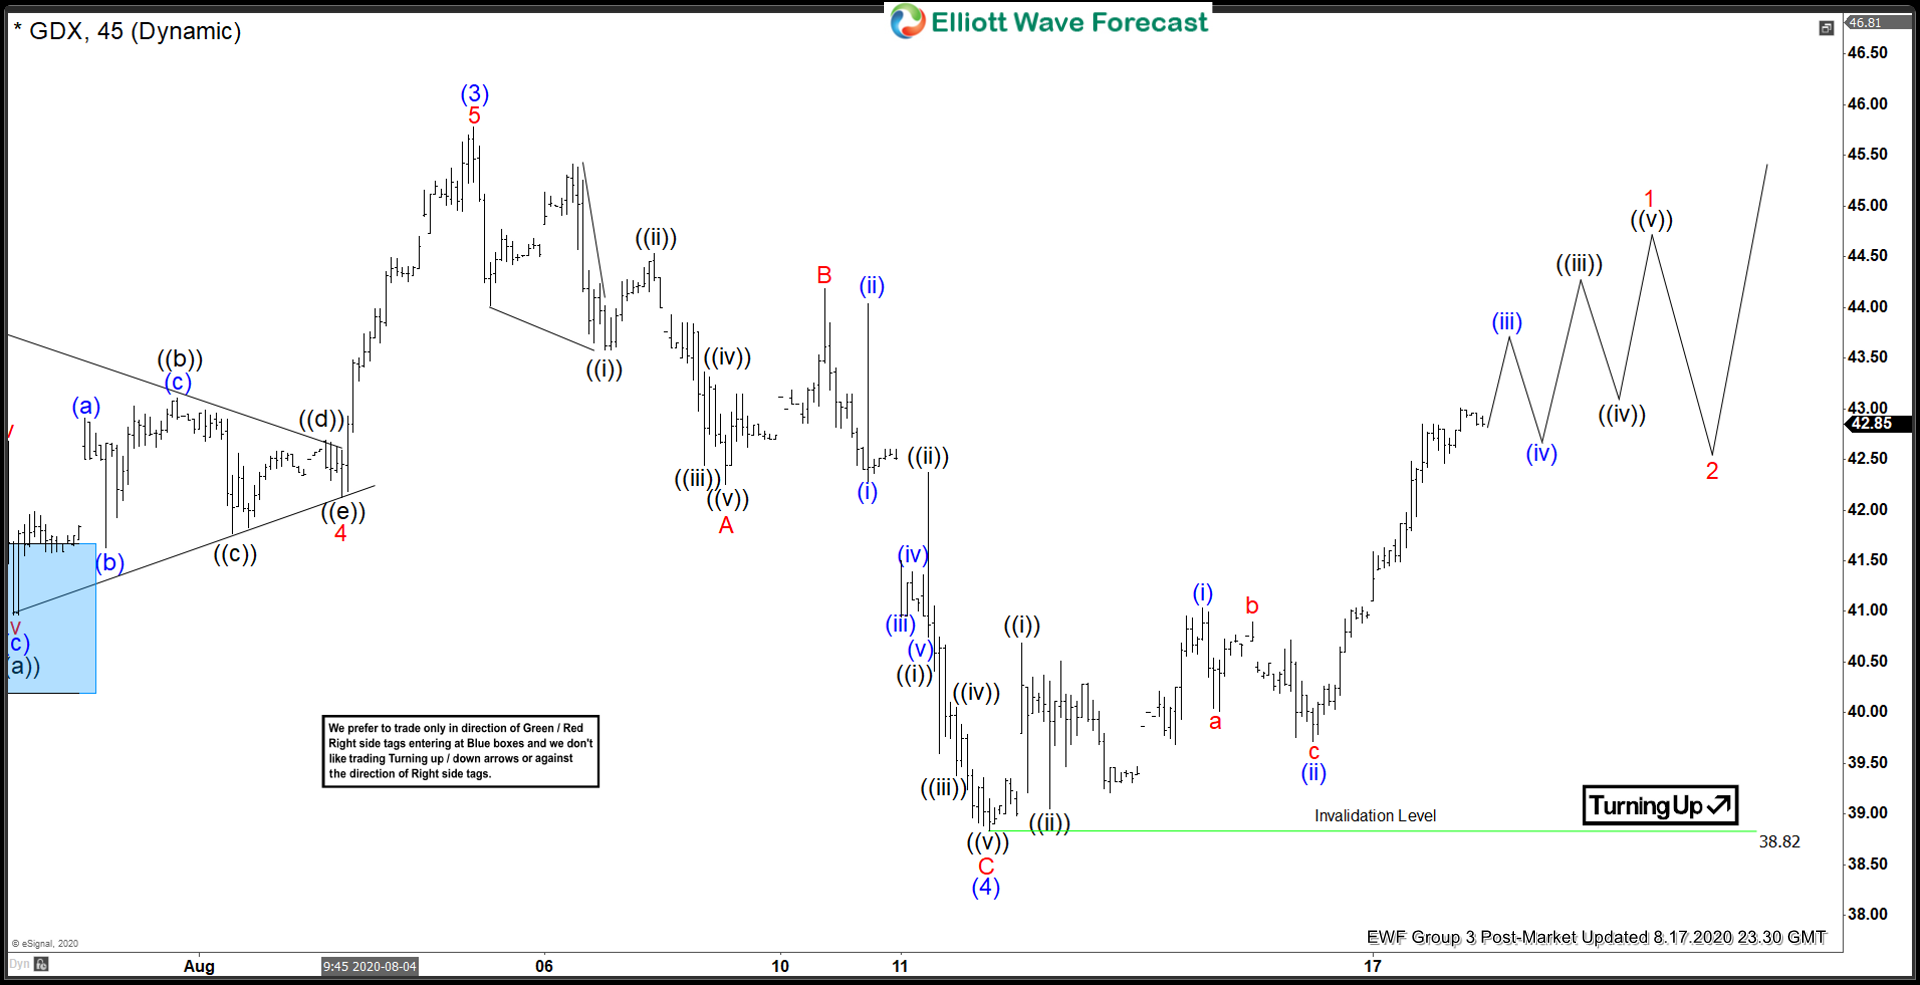
GDX 45 minutes chart below shows that the stock has ended the cycle from June 5 low as wave (3). The rally ended at 45.78 high. From there, the stock did a pullback in wave (4), which unfolded as a zigzag Elliott Wave Structure. Down from August 5 high, wave A ended at 42.25 low. The bounce in wave B ended at 44.18 high. Afterwards, the stock resumed lower in wave C, which ended at 38.82 low. This ended wave (4) in larger degree.
Afterwards, the stock has resumed higher from wave (4) low. Up from that low, the stock ended wave ((i)) at 40.69 high. Wave ((ii)) pullback ended at 39.05 low. Currently wave ((iii)) is in progress, where wave (i) of ((iii)) ended at 41.03 high and wave (ii) ended at 39.72 low. As long as pivot at 38.82 low stays intact, the dips in 3,7 or 11 swings is expected to find support for more upside. However, the stock still needs to break above wave (3) high at 45.78 to confirm that wave (4) is already in place and the next leg higher in wave (5) has started. Otherwise, the stock can still do a double correction in wave (4).
GDX 45 Minutes Elliott Wave Chart



Comments
Log in or sign up to join the conversation.