

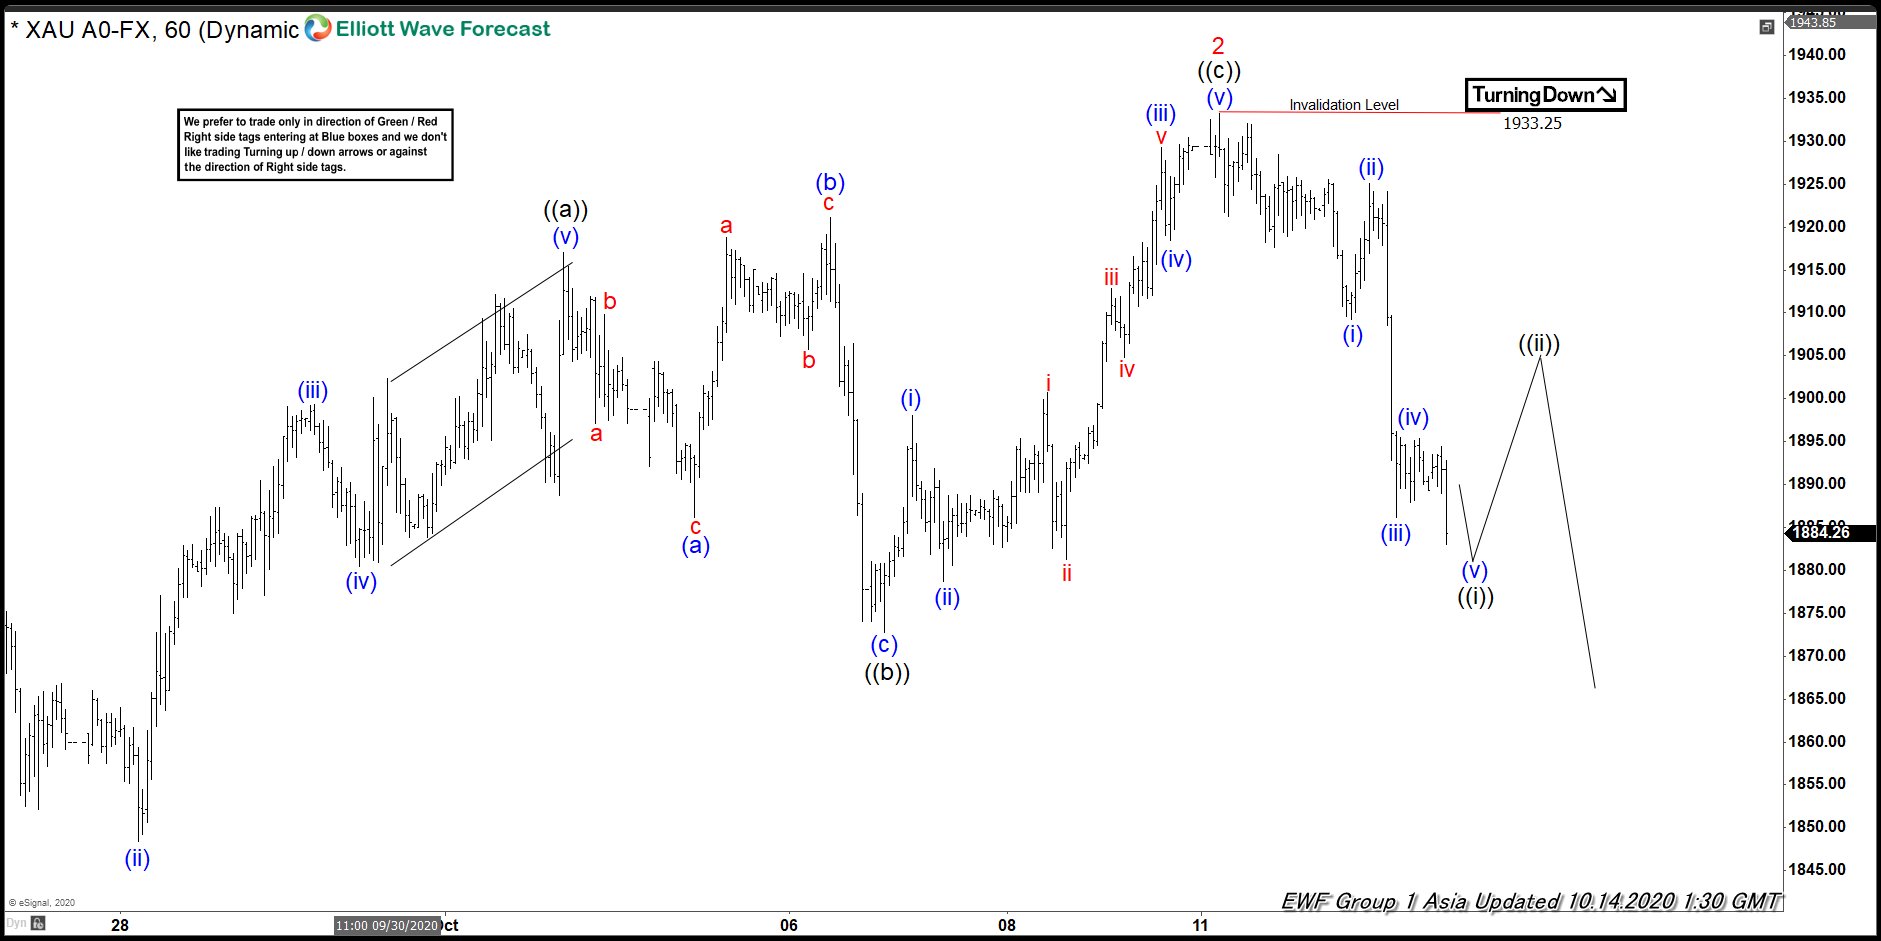
Elliott wave view in Gold ticker symbol: $XAUUSD suggests that the correction lower approximately towards $1801- $1669 area or a deep test of the 24 September 2020 low should be taking place. Right now, the bounce from the 9/24/2020 low has ended wave 2 in Gold. The internals of that bounce unfolded as Elliott wave zigzag structure where wave ((a)) ended at $1917.10 high. Down from there, wave ((b)) pullback unfolded as a lesser degree flat structure where wave (a) ended at $1886.20 low.
Wave (b) bounce ended at $1921.14 high and wave (c) completed at $1872.75 low thus completed wave ((b)) pullback. Up from there, the metal started wave ((c)) in an impulse sequence where wave (i) ended at $1898 high. Wave (ii) ended at $1878.70 low, wave (iii) ended at $1929.26 high, wave (iv) ended at $1918.40, and wave (v) ended at $1933.25 high, thus completed wave 2 correction. Below from there, the metal is showing 5 waves impulse sequence decline favoring a bounce to fail for another leg of weakness at least. Near-term, as far as the bounces fail below $1933.25 high expect metal to extend lower.
Gold 1 Hour Elliott Wave Chart



Comments
Log in or sign up to join the conversation.