

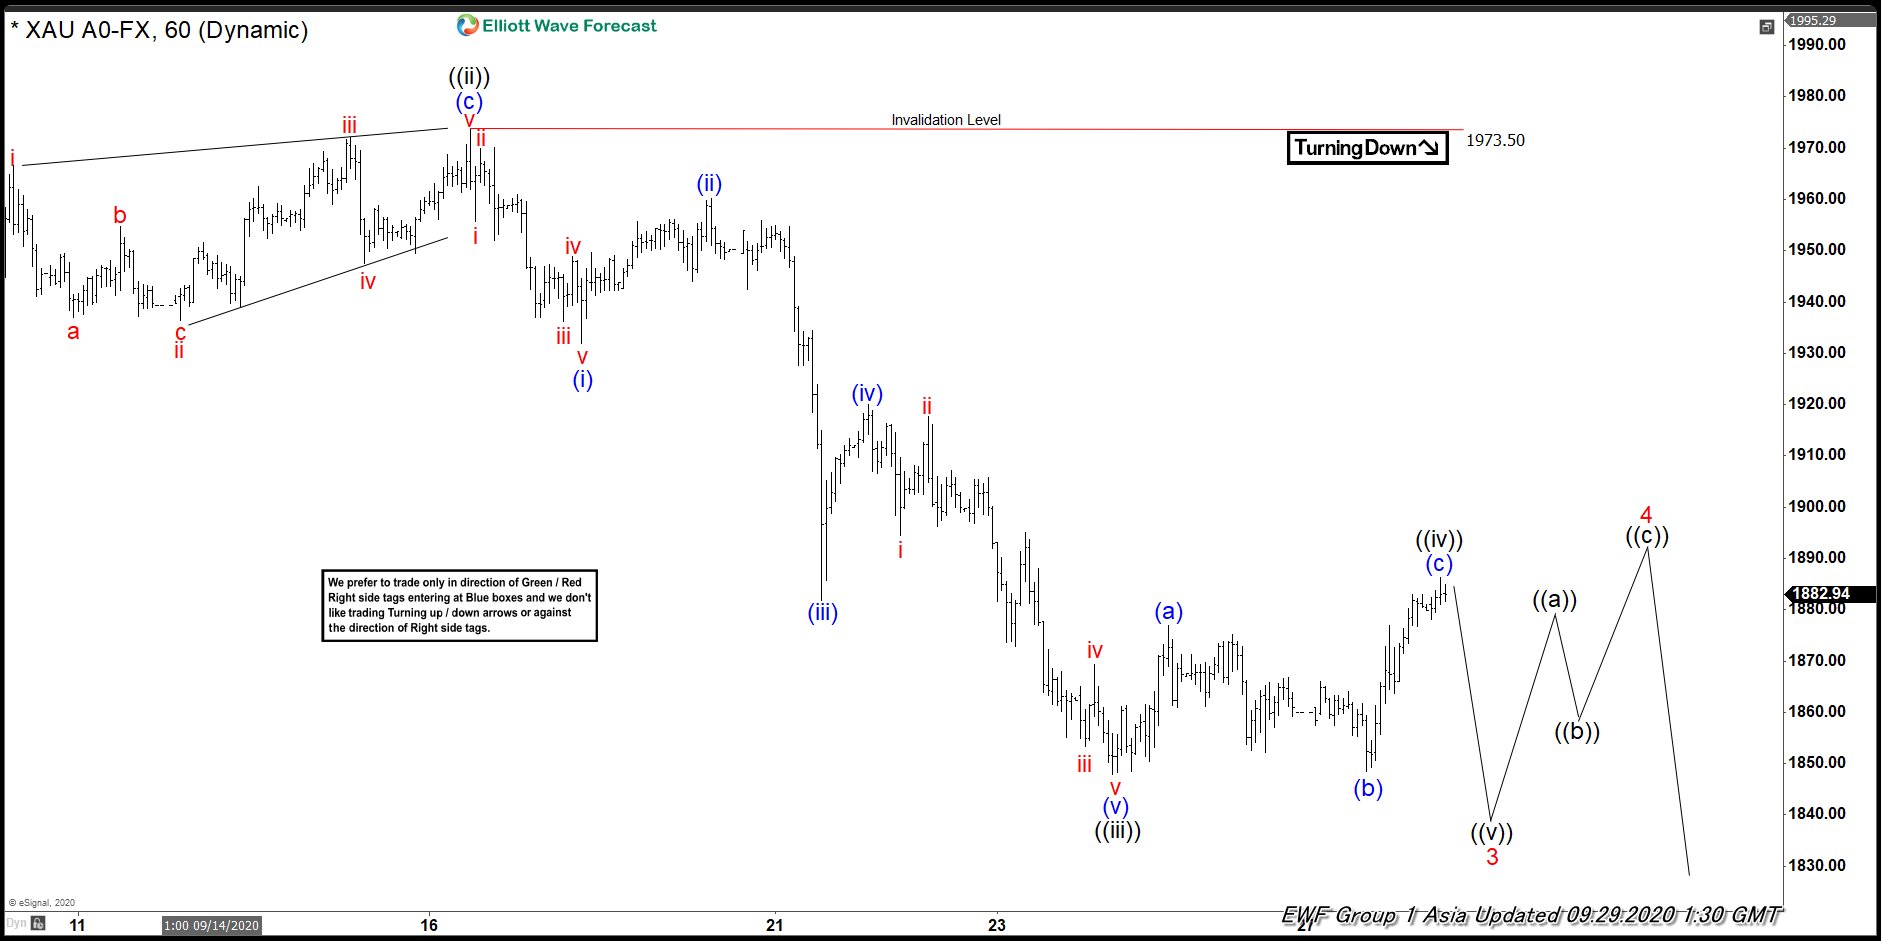
Elliott Wave view of Gold (XAUUSD) suggests the decline from September 1 high is unfolding in impulsive Elliott Wave structure. Down from September 1 high, wave ((i)) ended at $1915.8, and bounce in wave ((ii)) ended at $1973.59. Down from there, wave (i) ended at $1931.90, wave (ii) ended at $1960.14, wave (iii) ended at $1881.87, wave (iv) ended at $1920.02, and wave (v) ended at $1847.90. This completed wave ((iii)) in higher degree. Wave ((iv)) bounce is proposed complete at $1887.29 as a Flat where wave (a) ended at $1877.03, wave (b) ended at $1848.45, and wave (c) ended at $1887.29.
Near term, while below $1973.50, the yellow metal has scope for another low in wave ((v)) of 3, then it should bounce in wave 4 to correct cycle from September 1 high before the decline resumes again in wave 5 of (C) of ((4)). As far as pivot at $1973.50 high stays intact, Gold still can see further downside . Potential target lower is 100% - 123.6% Fibonacci extension from August 7 high which comes at $1752 - $1802. Buyers should be waiting in this area, if reached, for a larger 3 waves bounce at minimum.
Gold (XAUUSD) 60 Minutes Elliott Wave Chart



Comments
Log in or sign up to join the conversation.