

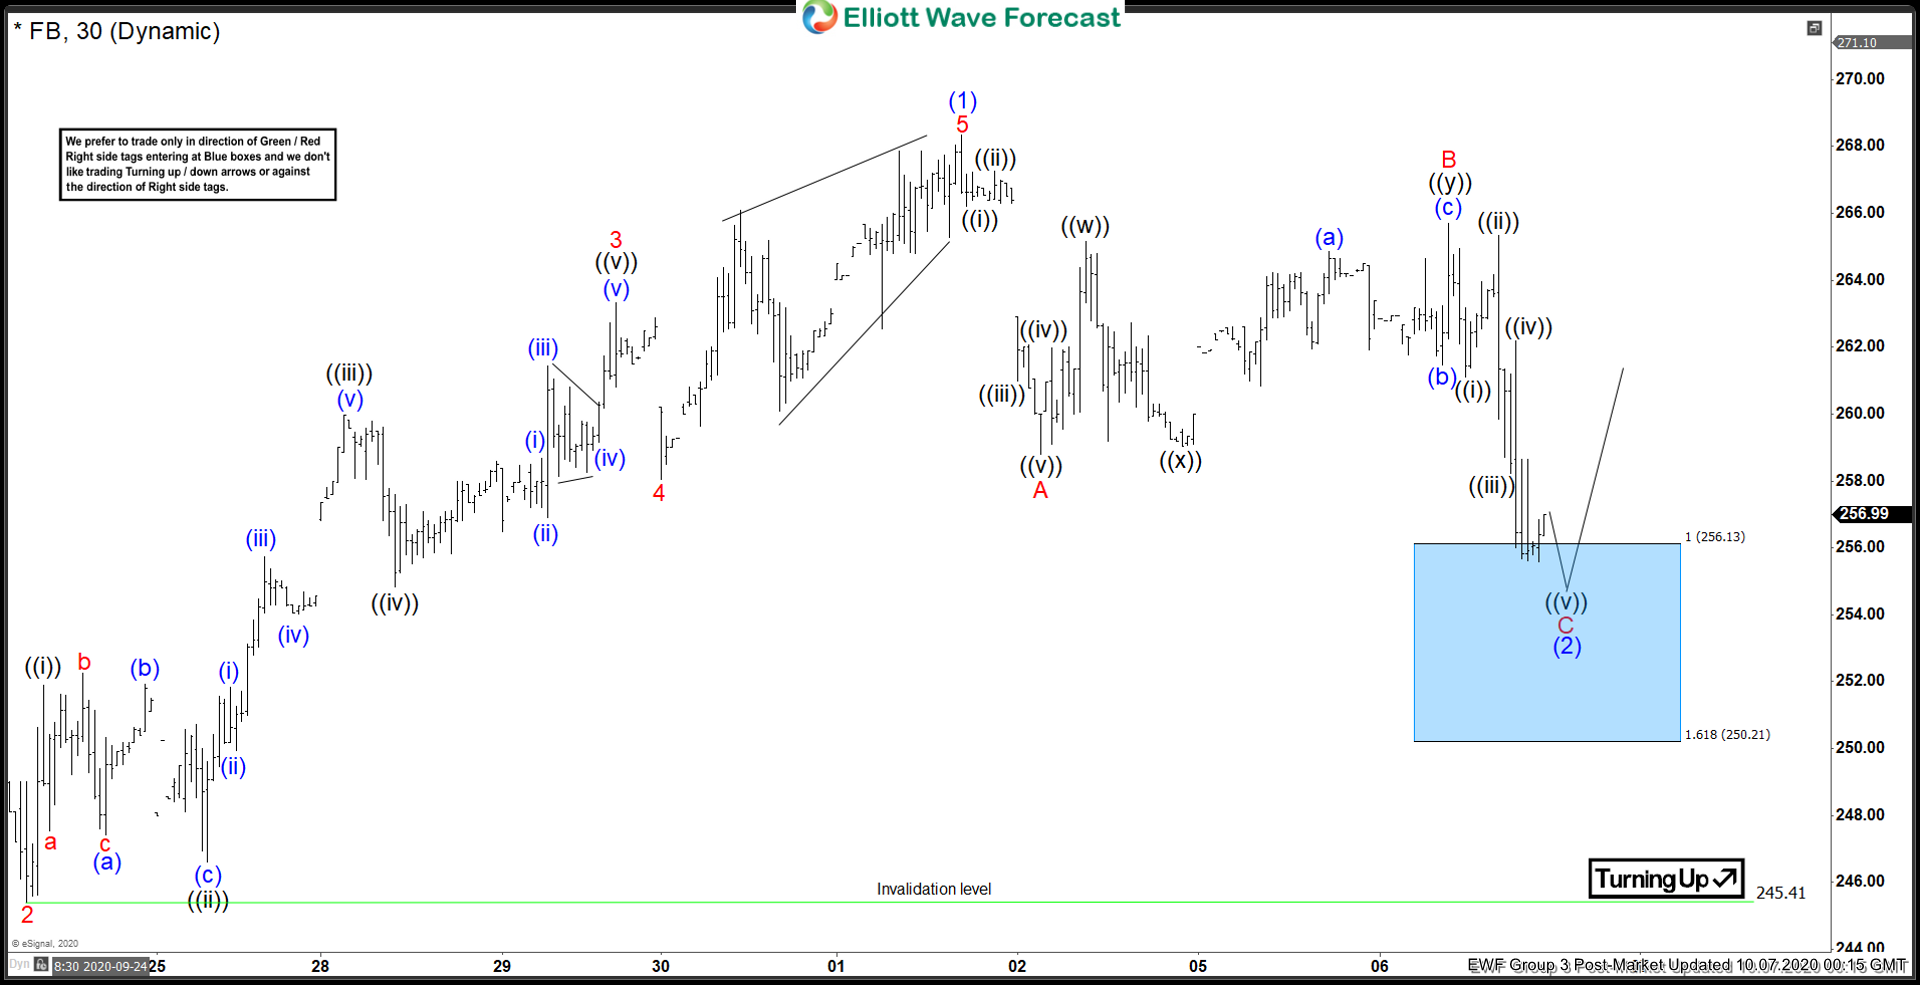
Elliott Wave view in Facebook (FB) calls the rally from September 21 low as a 5 waves impulse Elliott Wave structure. In the short term chart below, wave 2 is seen to have ended at $245.41. Up from there, wave ((i)) ended at 251.9, and wave ((ii)) pullback ended at $246.61. Wave ((iii)) ended at $259.98, wave ((iv)) ended at $254.82, and wave ((v)) ended at $263.33. This completed wave 3 in higher degree.
From there, pullback to $258.05 ended wave 4 and wave 5 ended at $268.33 as an ending diagonal. The 5 waves move from September 21 low ended wave (1) in higher degree. Wave (2) is now about to end as a zigzag structure. Wave A of (2) ended at $258.80 and wave B of (2) ended at $265.59. Stock has now reached the minimum target to end wave C of (2) at the blue box area of $250.2 - $256.1.
Expect Facebook soon to find buyers from the blue box area for more upside or 3 waves bounce at least. As far as pivot at $245.41 low remains intact, stock should see further upside.
Facebook (FB) 30 Minutes Elliott Wave Chart



Comments
Log in or sign up to join the conversation.