

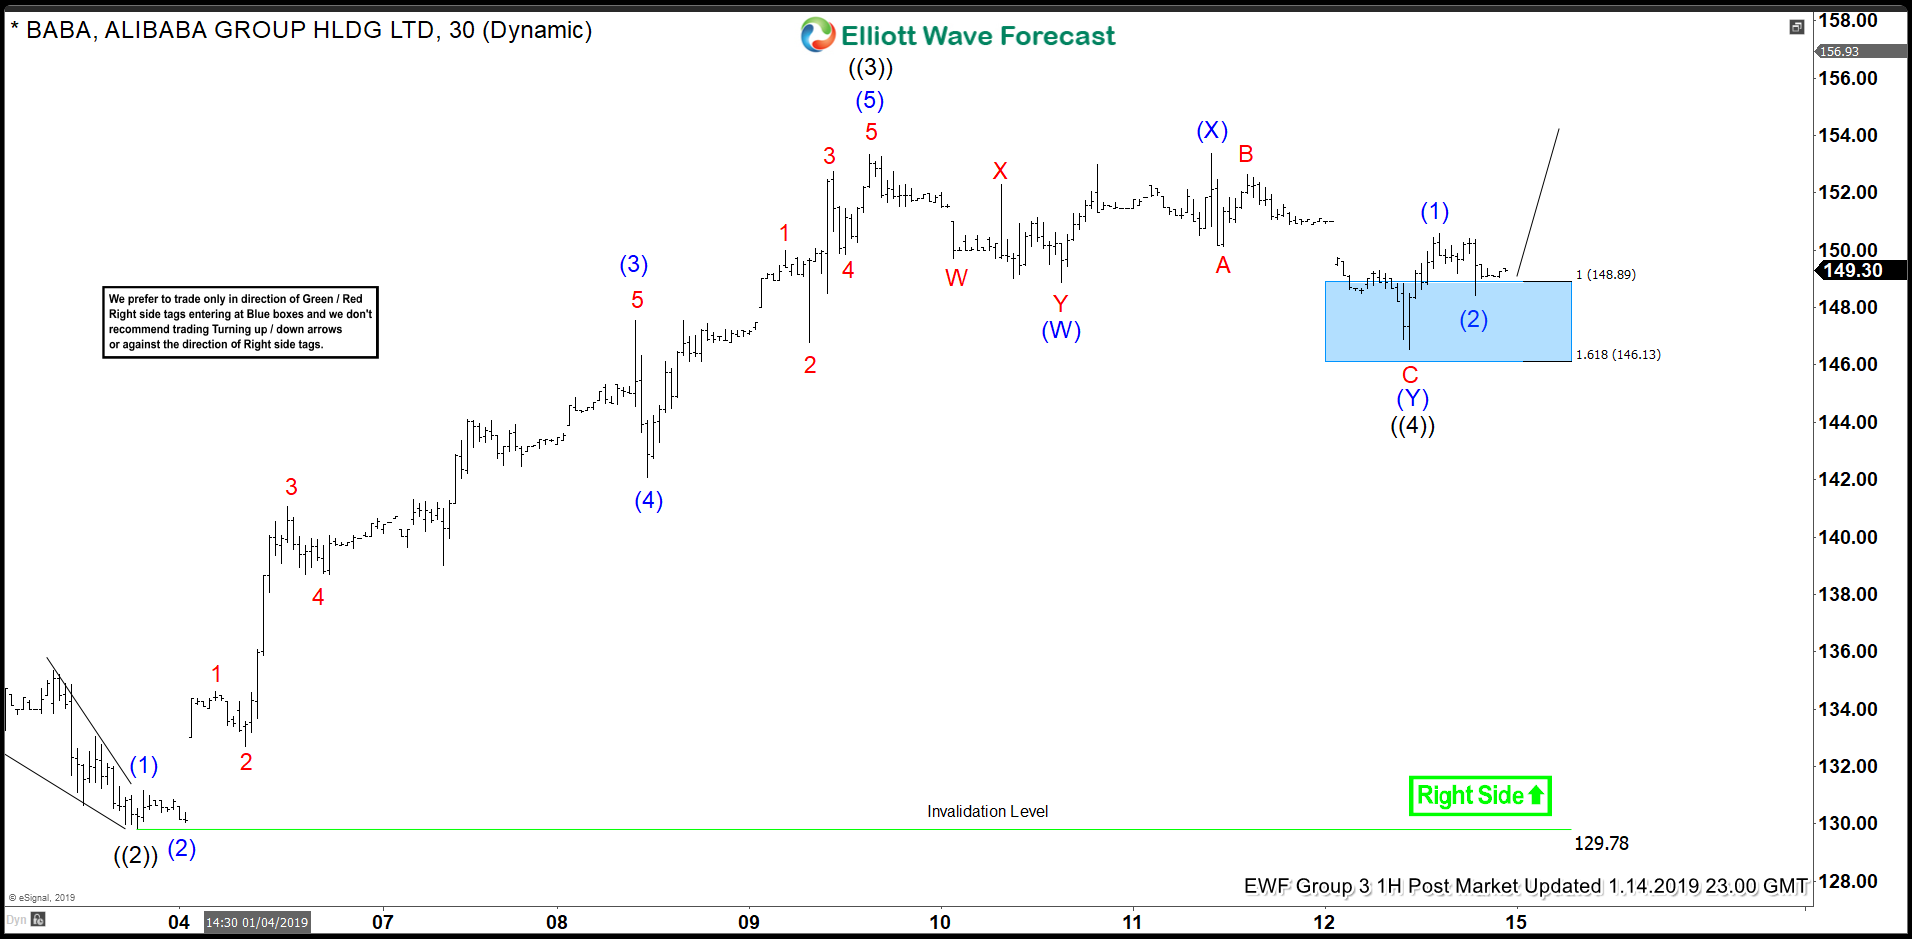
Short term Elliott Wave view of Alibaba (BABA) calls for the rally from Dec 24, 2018 low ($129.1) as a 5 waves impulse Elliott Wave structure. Up from there, wave ((1)) ended at $142.51 and wave ((2)) pullback ended at $129.99. Wave ((3)) rally ended at $153.35 and wave ((4)) pullback is proposed complete at $146.54. The stock still needs to break above wave ((3)) at $153.35 to avoid a double correction.
As an Impulse, internal of wave ((1)), ((3)), and ((5)) subdivide in 5 waves of lesser degree. Within wave ((3)), we see the lesser degree Impulse in wave (1) at $131.15, wave (2) at $130.05, wave (3) at $147.54, wave (4) at $142.06, and wave (5) at $153.35. Wave ((4)) pullback ended as a double three Elliott Wave structure, where wave (W) ended at $148.88, wave (X) ended at $153.38, and wave (Y) ended at $146.54.
Near term, expect Alibaba to extend higher in wave ((5)) while it stays above $146.54. Potential target wave ((5)) can reach as high as $160 - $163 area when wave ((5)) = ((1)). Afterwards, cycle from Dec 24, 2018 should end and Alibaba can pullback to correct that cycle in 3, 7, or 11 swing.
Alibaba (BABA) 1 Hour Elliott Wave Chart



Comments
Log in or sign up to join the conversation.