


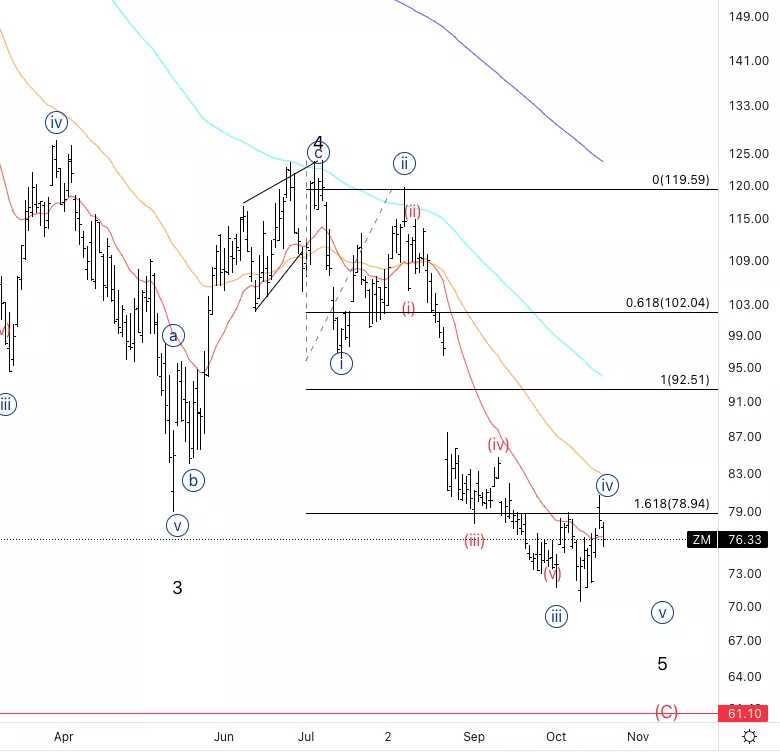
Zoom Video Communications Inc., (ZM): Daily Chart, October 20, 2022,
ZM Stock Market Analysis: Looking for further downside overall as there is no clear sign the trend is up and the most recent move down from wave 4 is only a three-wave move which makes it an incomplete bearish sequence.
ZM Elliott Wave count: wave {iv} of 5.
ZM Technical Indicators: We are using the 20EMA as resistance.
ZM Trading Strategy: Looking for further downside to being traded, however, wave {iv} could get larger.
Analyst: Alessio Barretta
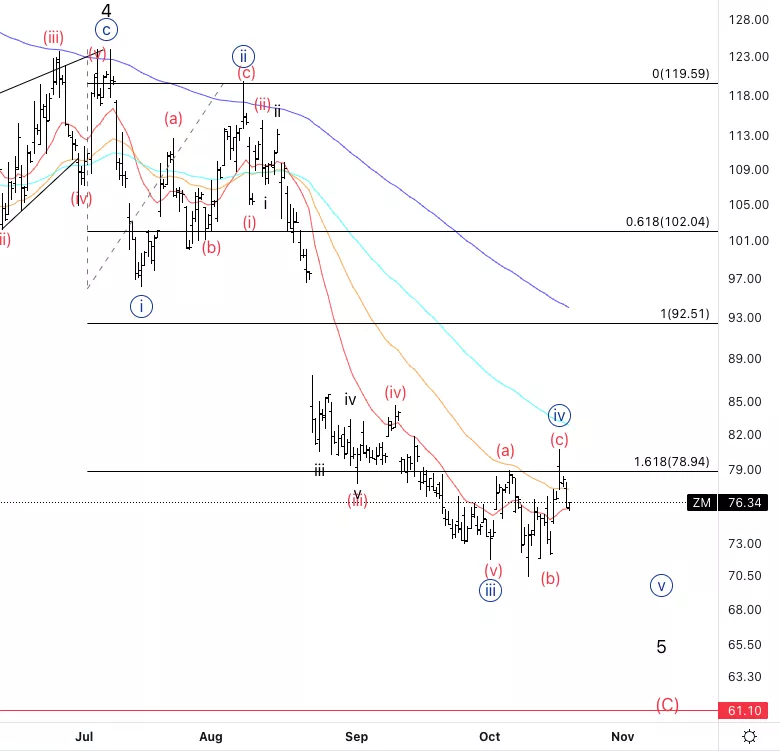
Zoom Video Communications Inc., ZM: 4-hour Chart, October 20, 2022
Zoom Video Communications Inc., Elliott Wave Technical Analysis
ZM Stock Market Analysis: Looking for wave {iv} to be either completed(current labeling) or else double correction higher.
ZM Elliott Wave count: wave {iv}.
ZM Technical Indicators:20EMa acting as support.
ZM Trading Strategy: We have a clear three-wave to the upside meaning the trend is still lower, therefore we can look for shorts.
More By This Author:
Elliott Wave Technical Analysis: Intel, Oct. 19
Elliott Wave Analysis: Australian Markets
Elliott Wave Technical Analysis: Ripple, Oct. 19



Comments
Log in or sign up to join the conversation.