

Image Source: Unsplash
United Parcel Service Inc., Elliott Wave Technical Analysis
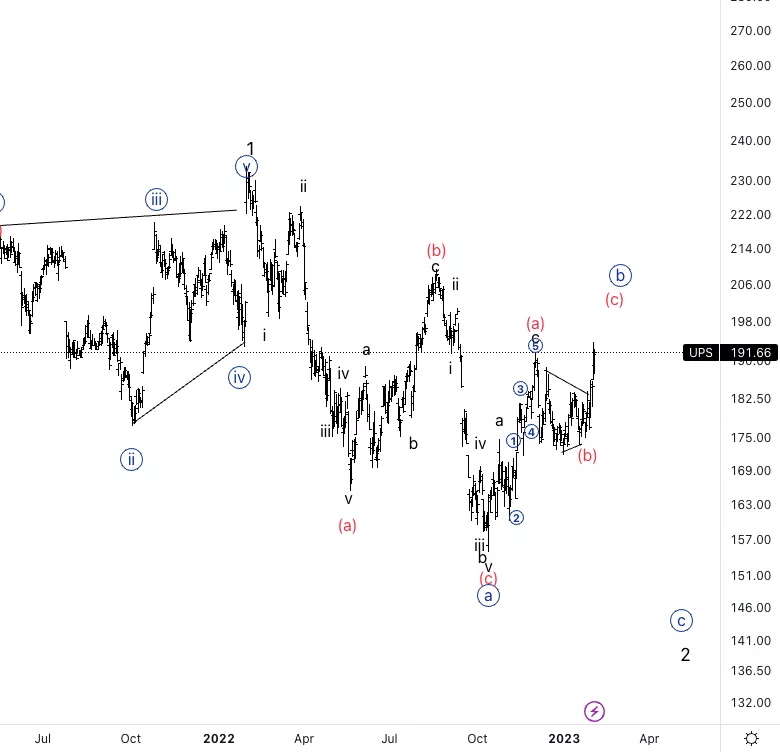
United Parcel Service Inc., (NYSE: UPS): Daily Chart, 6 February 2023.
UPS Stock Market Analysis: Looking for further upside into wave {b}, we wouldn’t want to see a wave (b) of {a} to be broken but act as resistance.
UPS Elliott Wave Count: Wave (c) of {b}.
UPS Technical Indicators: Above all averages.
UPS Trading Strategy: Looking for an end of wave {b} to then look for shorts.
Analyst: Alessio Barretta
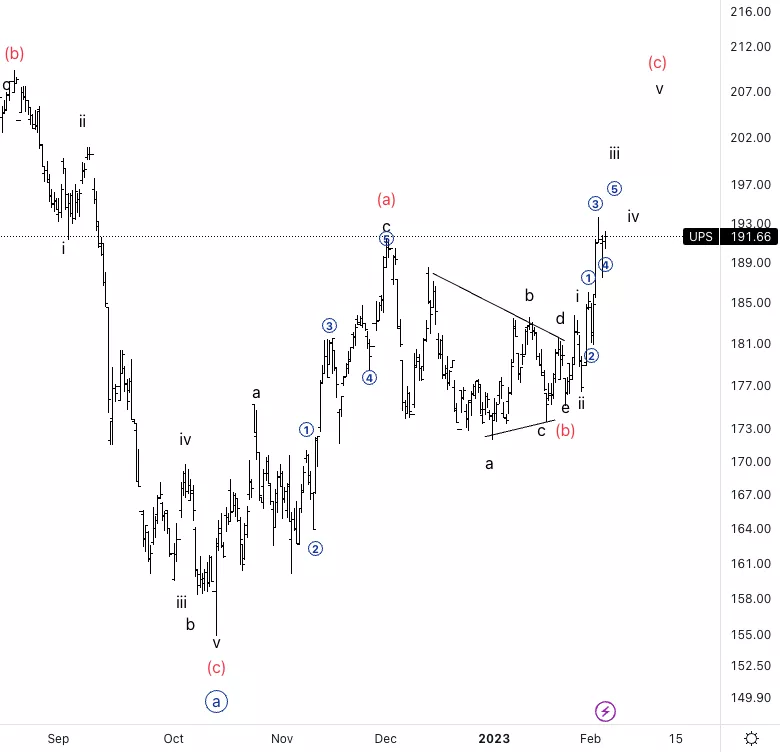
United Parcel Service Inc., UPS: 4-hour Chart, 6 February 2023.
United Parcel Service Inc., Elliott Wave Technical AnalysisUPS Stock Market Analysis: It looks like that after the triangle in wave (b), we are now in wave iii of (c). We could look for short-term longs on the pullback in wave iv.
UPS Elliott Wave count: wave 4 of iii.
UPS Technical Indicators: Above all averages.
UPS Trading Strategy: Looking for a pullback in wave iv to enter long.
More By This Author:
AAVE/USD Elliott Wave Technical Analysis, Monday Feb. 6
Elliott Wave Forecast: SP500, Nasdaq, Russell 2000, DJIA Show Bullish Momentum
Elliott Wave Technical Analysis: The Trade Desk Inc. - Friday, Feb. 3


Comments
Log in or sign up to join the conversation.