
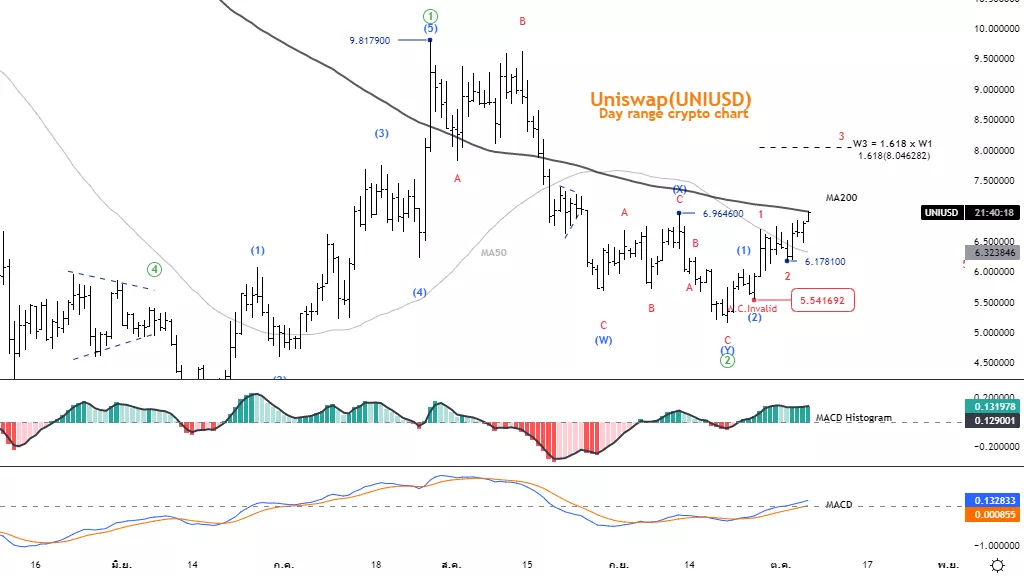
Elliott Wave Analysis TradingLounge Daily Chart, 6 October 2022,
Uniswap (UNI-X)
UNIUSD Elliott Wave Technical Analysis
Function: Follow trend
Mode: Motive
Structure: Impulse
Position: Wave 2
Direction Next higher Degrees: wave ((3)) of Motive
Details: Price tends to trade above 9.817, but must not reverse below 5.552
Wave Cancel invalid Level: 5.552
Uniswap Trading Strategy: The price tends to trade above 9.817, but be aware
of the important resistance at the MA200 line, if it fails, there is a chance to reverse again.
And it could be an opportunity to join the trend.
Uniswap (UNIUSD) Technical Indicators: The price is below the MA200, and
MASO line. momentum is bearish.
Tradinglounge Analyst : Kittiampon Somboonsod
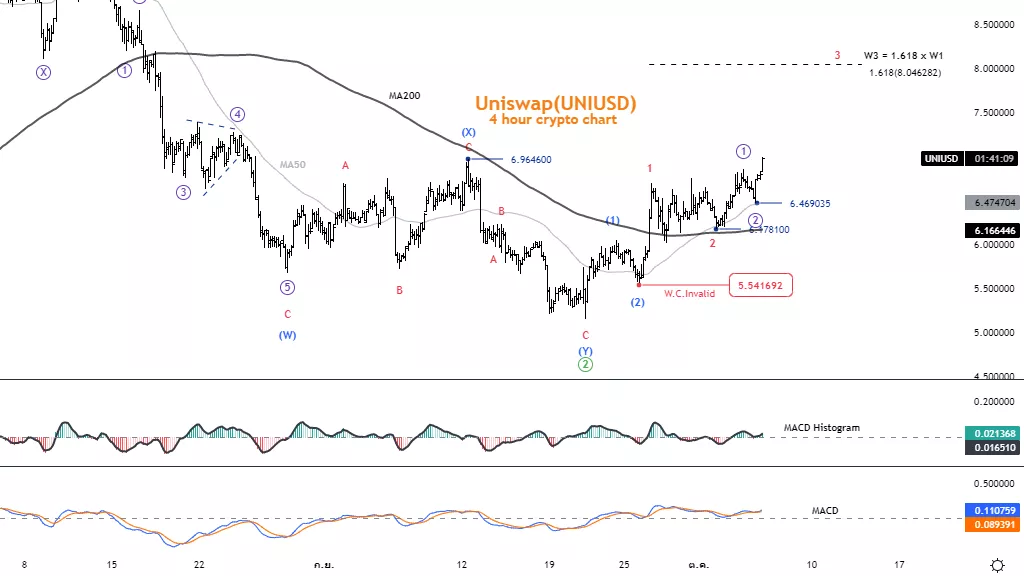
Uniswap
UNIUSD Elliott Wave Technical Analysis 4Hr Chart
Function: Follow trend
Mode: Motive
Structure: Impulse
Position: Wave 2
Direction Next higher Degrees: wave ((3)) of Motive
Details: Price tends to trade above 9.817, but must not reverse below 5.541
Wave Cancel invalid Level: 5.541
Uniswap Trading Strategy: The price tends to trade higher steadily, but the
MACD is declining. You may need to be cautious when trading during this period. But
even then, Momentum is still positive above the MA200 and MAS50 lines.
Uniswap Technical Indicators: The price is above the MA200, and MASO line. Momentum is Bullish.
More By This Author:
S&P 500 Elliott Wave Technical Analysis
CSX Corporation, Elliott Wave Technical Analysis October 5 2022
DAX 40, FTSE 100, EUROSTOXX 50, Dollar, GBPUSD, EURUSD - Elliott Wave Technical Analysis


Comments
Log in or sign up to join the conversation.