
Twist Bioscience Corp., Elliott Wave Technical Analysis
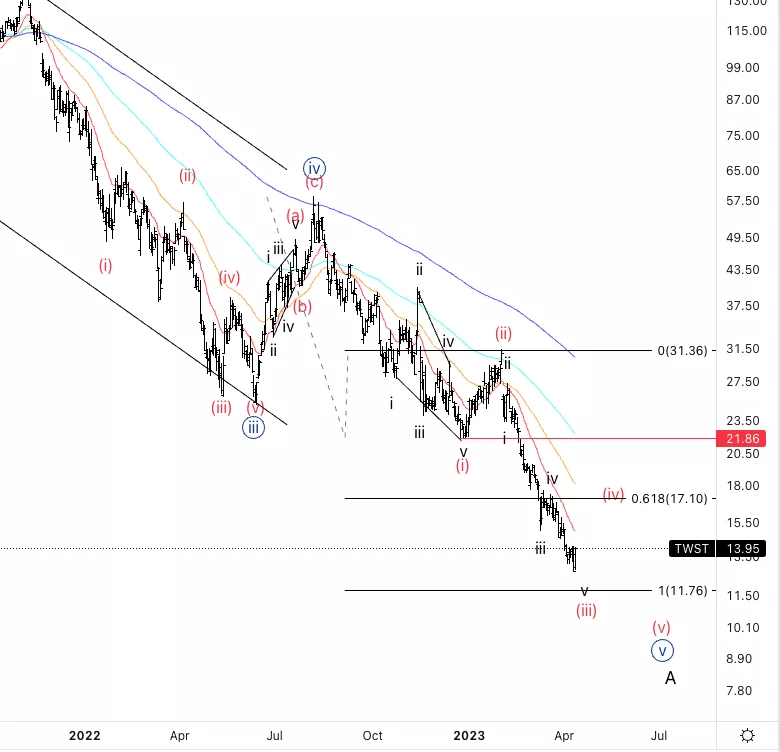
Twist Bioscience Corp., (TWST): Daily Chart, 14 April 23,
TWST Stock Market Analysis: It has been moving perfectly ever since the last update. Looking for a continuation lower, even though it seems like we could be looking for support soon as we approach equality of (iii) vs. (i).
TWST Elliott Wave Count: Wave (iii) of {v}.
TWST Technical Indicators: Below all averages.
TWST Trading Strategy: Looking for further downside.
TradingLounge analyst: Alessio Barretta
(Click on image to enlarge)
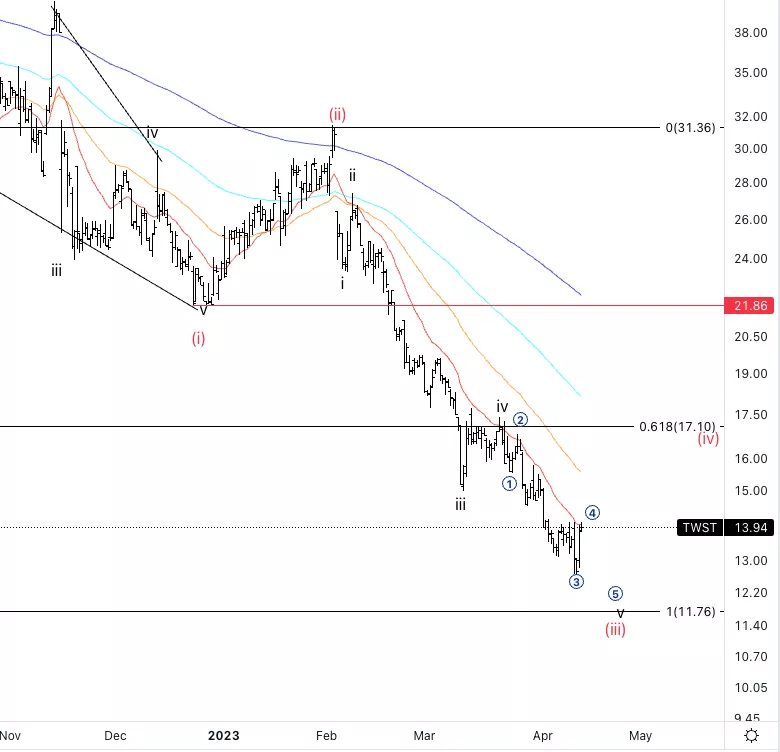
Twist Bioscience Corp., TWST: 4-hour Chart, 14 April 23,
Twist Bioscience Corp., Elliott Wave Technical Analysis
TWST Stock Market Analysis: Looking for a correction in micro-wave 4 to then resume lower as we find resistance on the 20EMA.
TWST Elliott Wave count: Wave v of (iii).
TWST Technical Indicators: Resistance on the 20EMA:.
TWST Trading Strategy: Looking for further downside.
(Click on image to enlarge)
More By This Author:
Commodity Futures Markets Report
Elliott Wave Technical Analysis: Netflix Inc.
Elliott Wave Analysis: European Markets - Thursday, April 13


Comments
Log in or sign up to join the conversation.