


Image Source: Unsplash
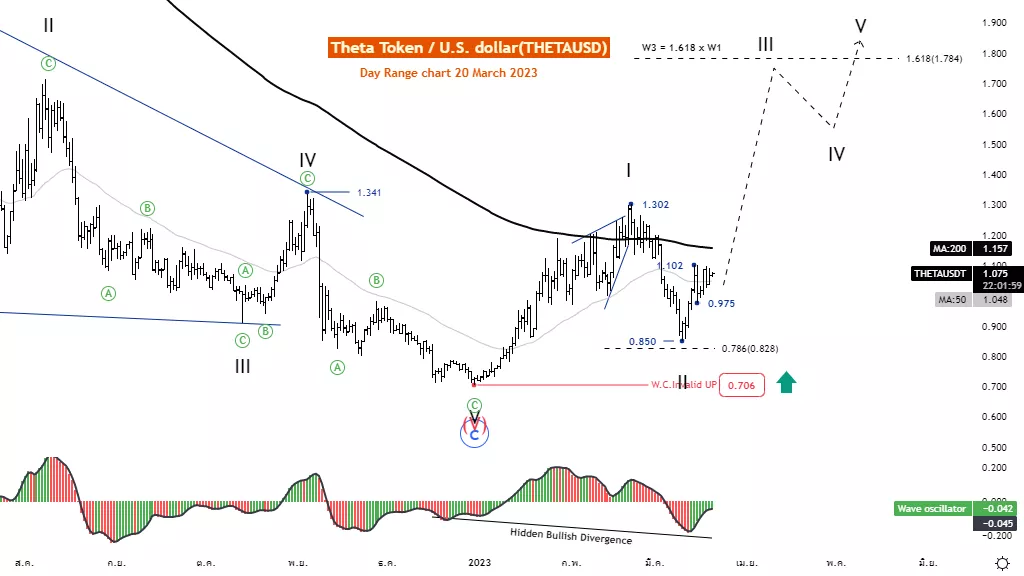
Elliott Wave Analysis TradingLounge Daily Chart, 19 March 2023.
Theta Token/U.S. Dollar (THETAUSD)
THETAUSD Elliott Wave Technical Analysis
Function: Follow trend
Mode: Motive
Structure: Impulse
Position: Wave III
Direction Next higher Degrees: wave (I) of Impulse
Wave Cancel invalid Level: 0.706
Details: Wave II is likely to end at the level of 0.85 and a five-wave rise from this level will confirm it.
Theta Token/U.S. Dollar (THETAUSD) Trading Strategy: Theta Token price has recovered well from the 0.850 level but the price is still in a downtrend as it is below the MA200 line, even then we have completed the second wave retracement and the retracement of the 0.850 level. A five-wave rally confirms this idea, making the price likely to trade above 1.302 and potentially leading to 1.784.
Theta Token/U.S. Dollar (THETAUSD) Technical Indicators: The price is below the MA200 indicating a downtrend. The wave oscillators below Zero-Line momentum are bearish.
Analyst: Kittiampon Somboonsod, CEWA
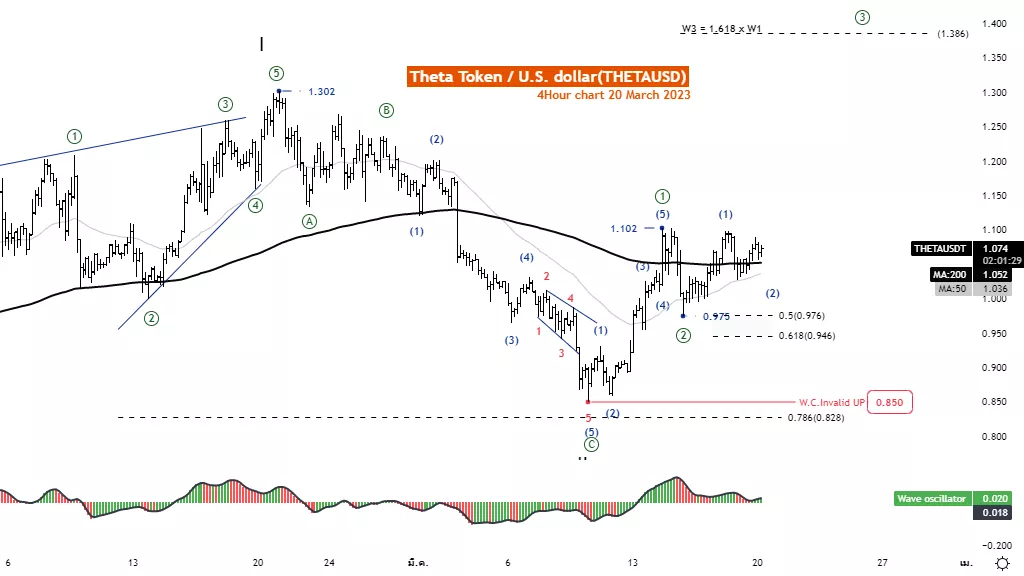
Elliott Wave Analysis TradingLounge 4H Chart, 19 March 2023.
Theta Token/U.S. Dollar (THETAUSD)
THETAUSD Elliott Wave Technical Analysis
Function: Follow trend
Mode: Motive
Structure: Impulse
Position: Wave III
Direction Next higher Degrees: wave (I) of Impulse
Wave Cancel invalid Level: 0.706
Details: Wave II is likely to end at the level of 0.85 and a five-wave rise from this level will confirm it.
Theta Token/U.S. Dollar (THETAUSD) Trading Strategy: Theta Token Well recovered from the level of 0.850 and managed to cross the MA200 line, so the trend has a chance to turn bullish again. We also predicted the end of the second wave reversal and the five-wave rise confirming this idea. The price is likely to trade above 1.302 and could lead to 1.784.
Theta Token/U.S. Dollar (THETAUSD) Technical Indicators: The price is above the MA200 indicating an uptrend. The wave oscillators above Zero-Line momentum are bullish.
More By This Author:
ASX200 Summary, Nasdaq Stocks, Metals - Elliott Wave Analysis
Elliott Wave Technical Analysis: Shopify Inc. - Friday, March 17
Elliott Wave Technical Analysis: Binance Coin / U.S. Dollar



Comments
Log in or sign up to join the conversation.