

Image Source: Unsplash
Shopify Inc., Elliott Wave Technical Analysis
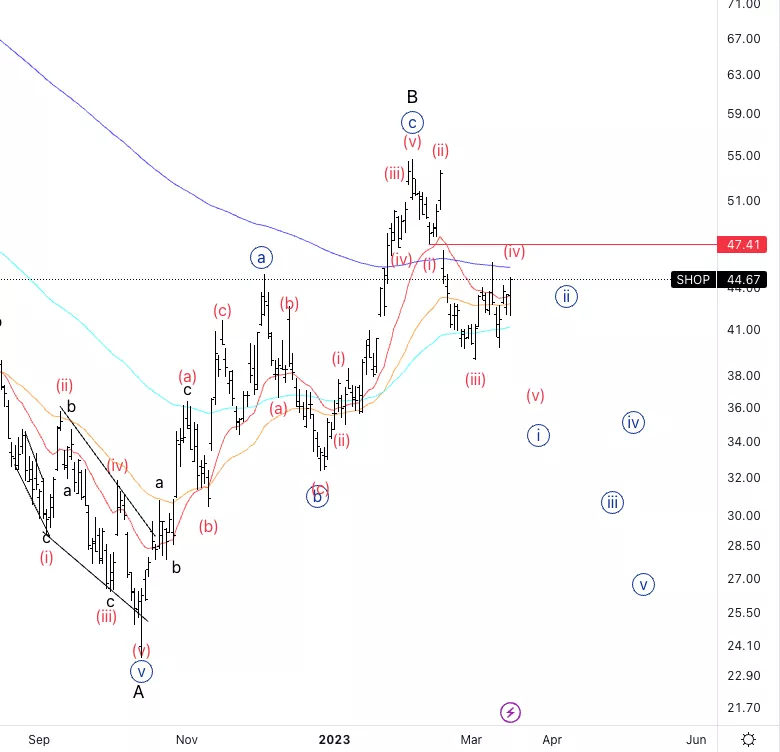
Shopify Inc., (Nasdaq: SHOP): Daily Chart, 17 March 2023.
SHOP Stock Market Analysis: the overall count has not changed since the last update. We are still looking for further downside into wave (v) the alternate would be a three wave move to the upside to then resume lower.
SHOP Elliott Wave Count: Wave (iv) of {i}.
SHOP Technical Indicators: At the cross of 20 and 200EMA.
SHOP Trading Strategy: Waiting for a potential triangle in wave (iv).
Analyst: Alessio Barretta
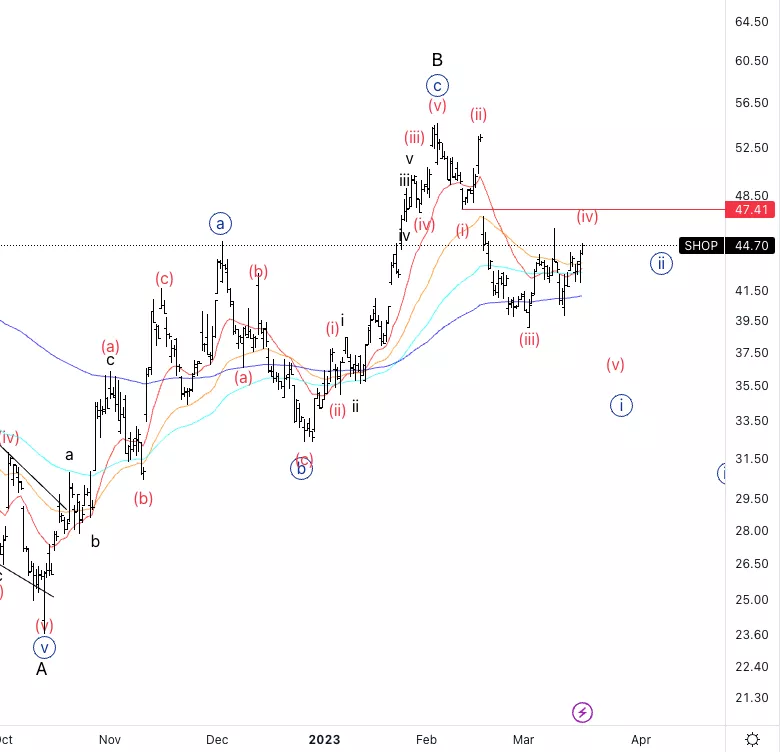
Shopify Inc., SHOP: 4-hour Chart, 17 March 2023.
Shopify Inc., Elliott Wave Technical Analysis SHOP Stock Market Analysis: The initial move higher into wave (iv) appear to be a three wave move which gives us the confirmation we are in a corrective structure. Looking for a sideways movement to confirm the count, without breaking the red line.
SHOP Elliott Wave count: Wave (iv) of {i}.
SHOP Technical Indicators: Above all averages.
SHOP Trading Strategy: Looking for sideways continuation in wave (iv).
More By This Author:
U.S. Stocks: SP500 Elliott Wave Analysis
Elliott Wave Technical Analysis: Spotify, Thursday, March 16
Elliott Wave Technical Analysis: Theta Coin


Comments
Log in or sign up to join the conversation.