

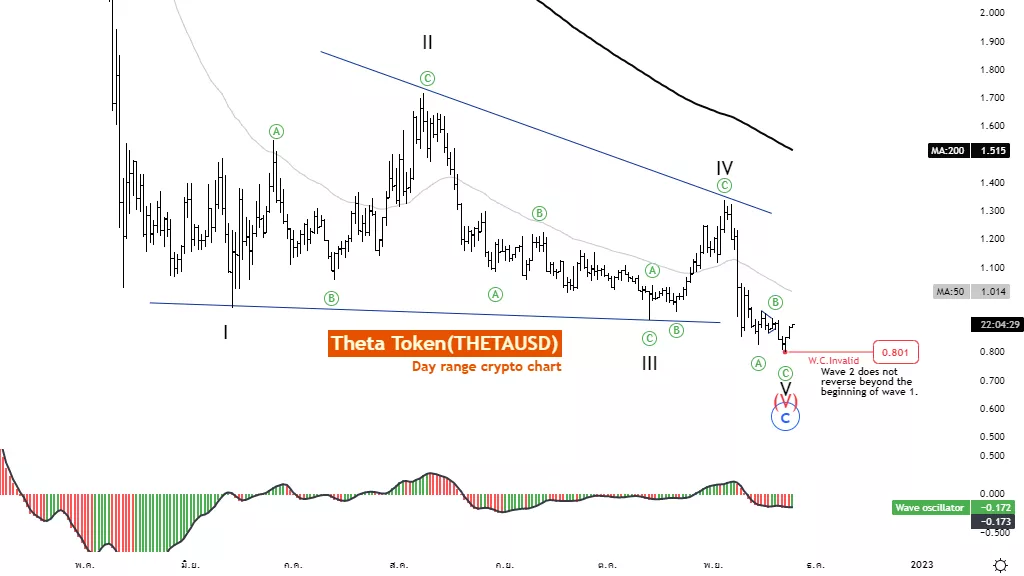
Elliott Wave Analysis TradingLounge Daily Chart, Thursday, Nov. 24
Theta Token (THETA-X)
THETAUSD Elliott Wave Technical Analysis
Function: Follow trend
Mode: Motive
Structure: Diagonal
Position: Wave 5
Direction Next higher Degrees: wave (5) of Motive
Details: Diagonal pattern at the end of the trend, When is complete the price rising again
Wave Cancel invalid Level: 0.801
Theta Token(THETAUSD) Trading Strategy: price continues to be under heavy selling pressure, below the MA200 MA50, indicating a strong downtrend. The wave oscillator is below the zero line with decreasing momentum. Even so, the bullish divergence is showing signs of reversal, so the overall price is likely to reverse again.
And the price is expected to trade above 1.400, but not reverse below 0.801
Theta Token(THETAUSD) Technical Indicators: The price is below the MA200 MA50, indicating a clear downtrend. The Wave oscillator is below the Zero-Line is a bearish momentum.
TradingLounge Analyst: Kittiampon Somboonsod
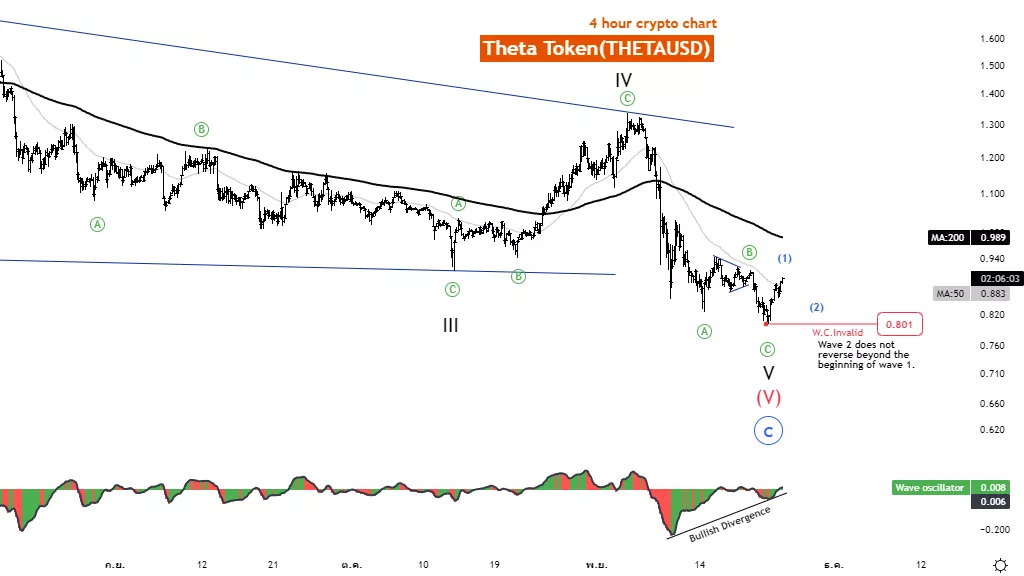
Elliott Wave Analysis TradingLounge 4H Chart, November 24, 2022
Theta Token (THETAUSD)
THETAUSD Elliott Wave Technical Analysis
Function: Follow trend
Mode: Motive
Structure: Diagonal
Position: Wave 5
Direction Next higher Degrees: wave (5) of Motive
Details: Diagonal pattern at the end of the trend, When is complete the price rising again
Wave Cancel invalid Level: 0.801
Theta Token(THETAUSD) Trading Strategy: price continues to be under heavy selling pressure, below the MA200 MA50, indicating a strong downtrend. The wave oscillator is below the zero line with decreasing momentum. Even so, the bullish divergence is showing signs of reversal, so the overall price is likely to reverse again.
And the price is expected to trade above 1.400, but not reverse below 0.801
Theta Token(THETAUSD) Technical Indicators: The price is below the MA200 MA50, indicating a clear downtrend. The Wave oscillator has a Bullish divergence Price maybe reversal.
More By This Author:
SP500, Nasdaq, Russell 2000, And Dow Jones: Elliott Wave Technical Analysis
Elliott Wave Technical Analysis: Analog Devices Inc. - Wednesday, Nov. 23
Elliott Wave Technical Analysis: Bitcoin - Wednesday, Nov. 23



Comments
Log in or sign up to join the conversation.