

Image Source: Pixabay
Analog Devices Inc., Elliott Wave Technical Analysis
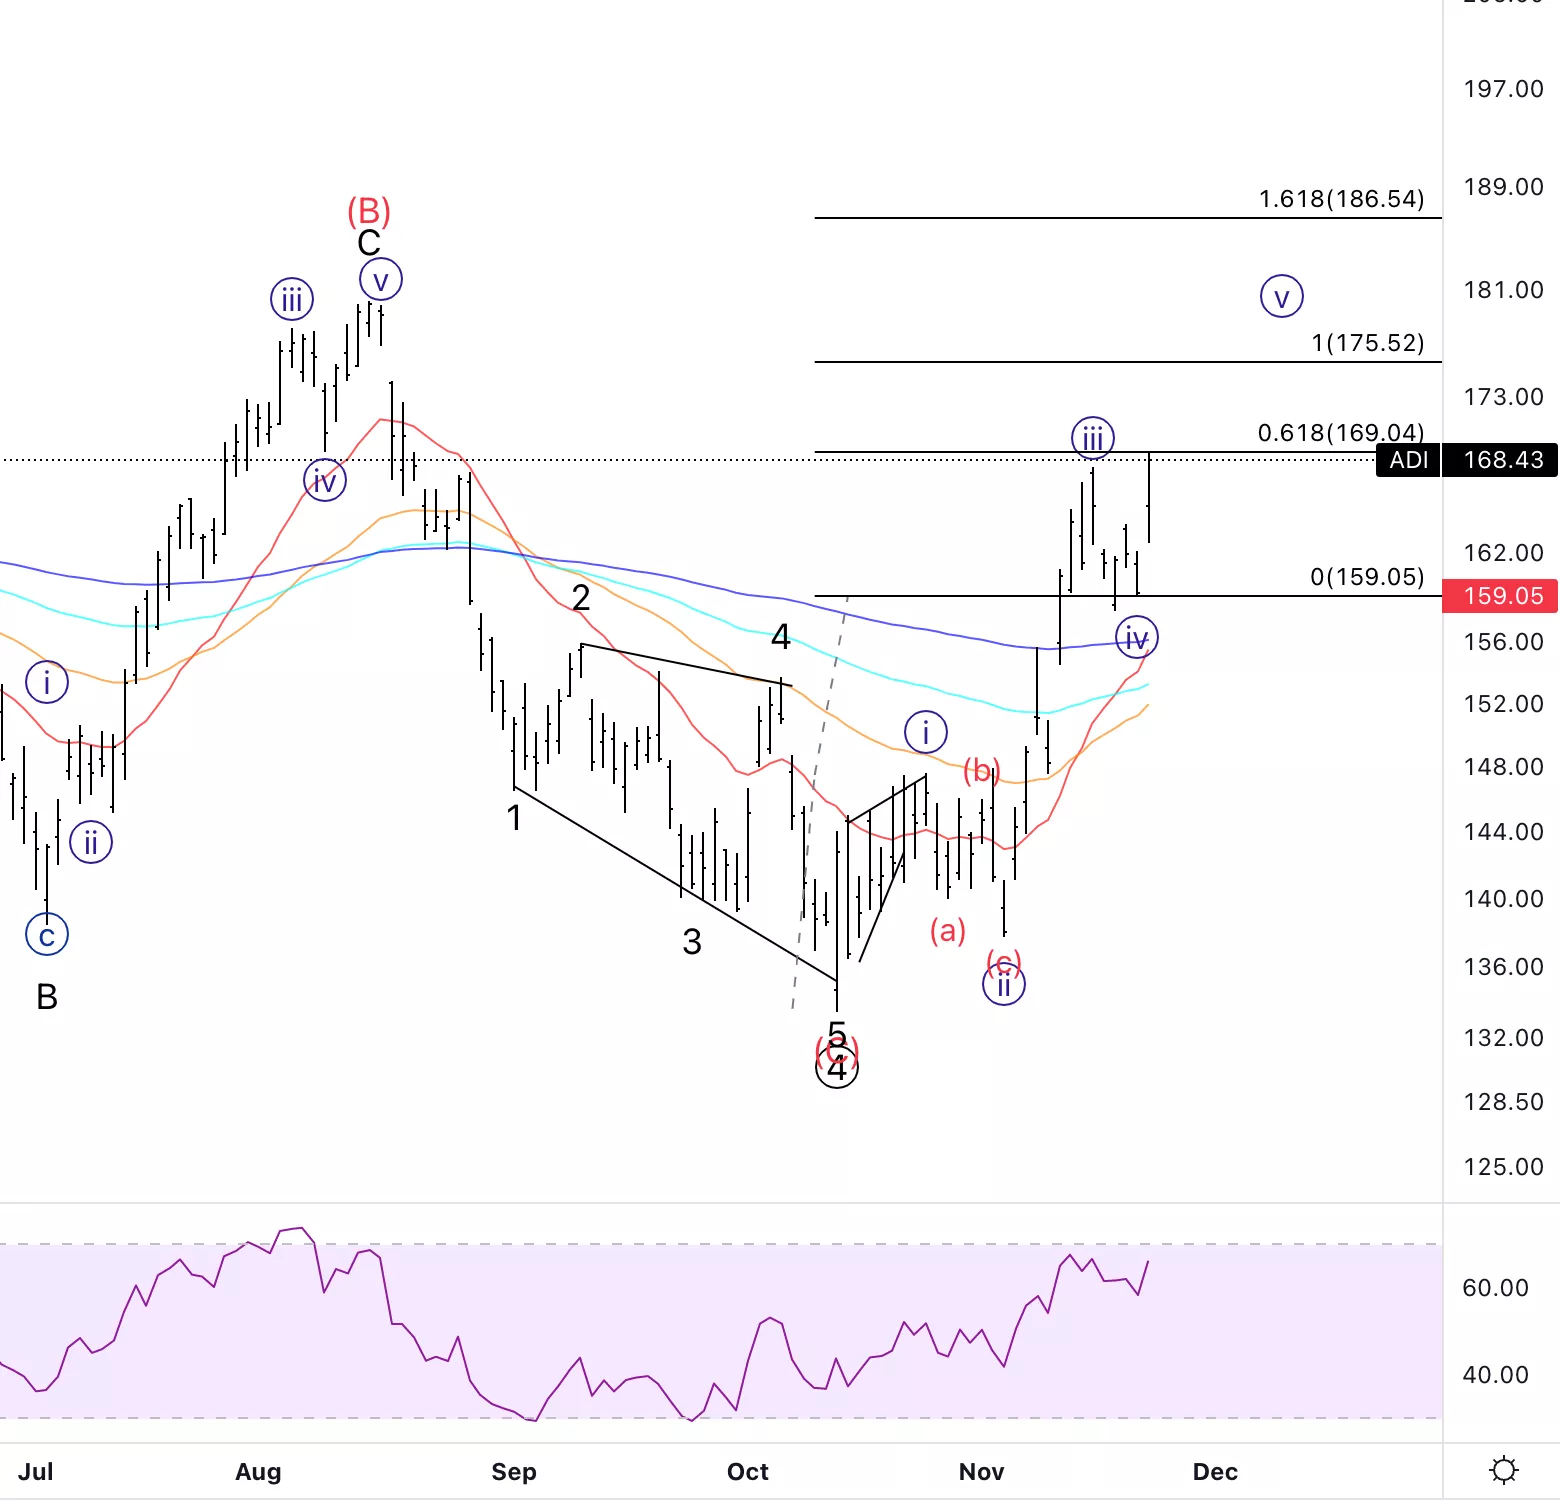
Analog Devices Inc., (Nasdaq: ADI): Daily Chart, November 23, 2022,
ADI Stock Market Analysis: Moving higher as expected, looking for further upside into wave {v}as we already broke previous wave {iii}. Eventually, we’ll be looking into longer-term positions if we are completing a higher degree wave 1 and consequentially 2.
ADI Elliott Wave Count: Wave {v} of 1.
ADI Technical Indicators: Above all averages.
ADI Trading Strategy: Looking for equality of {v} vs. {i} to be reached at 175$
Analyst: Alessio Barretta
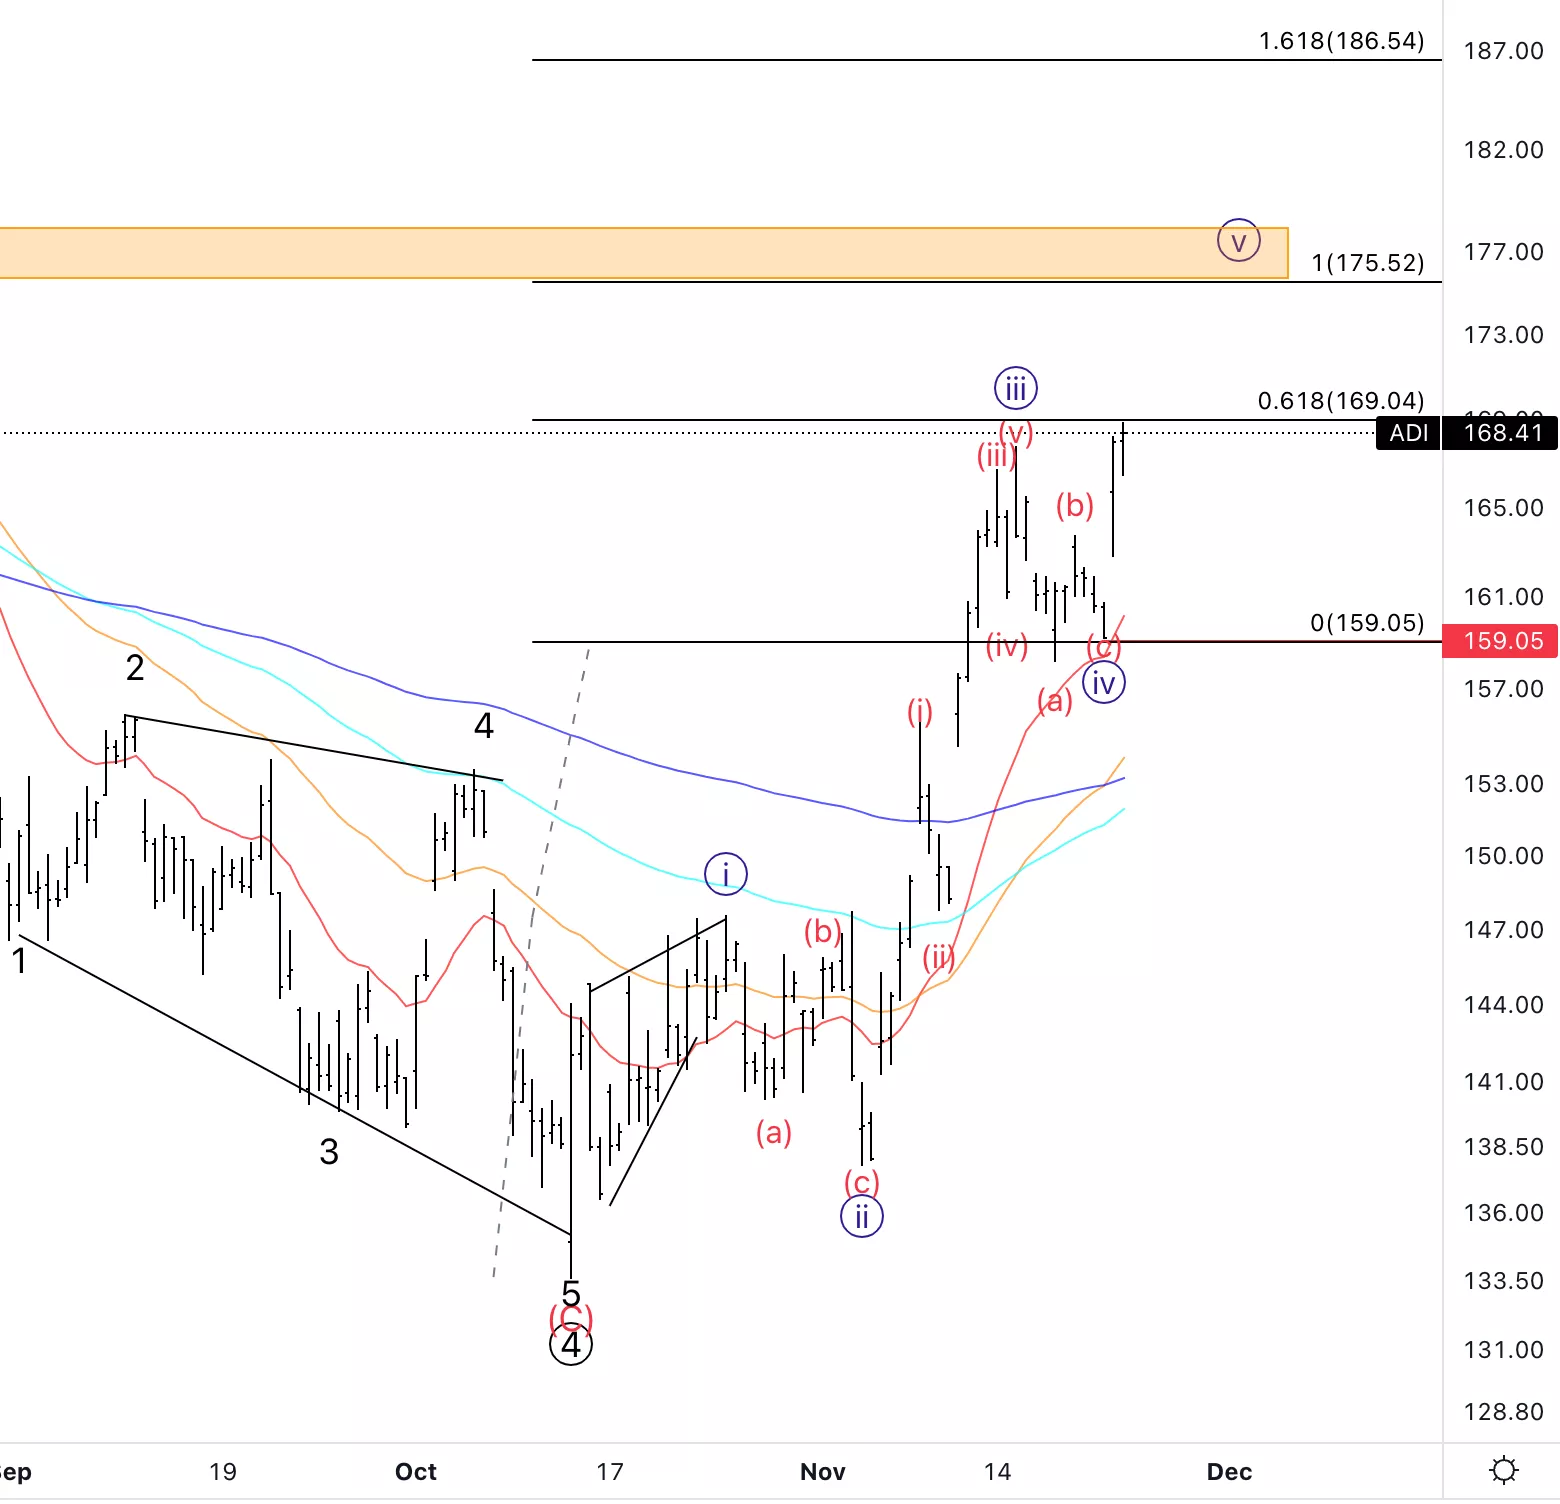
Analog Devices Inc., ADI: 4-hour Chart, November 23, 2022
Analog Devices Inc., Elliott Wave Technical Analysis
ADI Stock Market Analysis: Looking for further upside into wave {v} as we are approaching0.618 of {v} vs. {i} and we have an open gap to be potentially filled where the yellow rectangle is.
ADI Elliott Wave count: Wave (i) of {v}.
ADI Technical Indicators: Above all averages.
ADI Trading Strategy: Looking for short-term longs to build into wave {v}.
More By This Author:
DAX Today: DAX 40 Index Chart And Forecasts Elliott Wave
U.S. Stocks Elliott Wave Analysis - Market To Push Higher
Elliott Wave Technical Analysis: Intel Corp. - Tuesday, Nov. 22


Comments
Log in or sign up to join the conversation.