
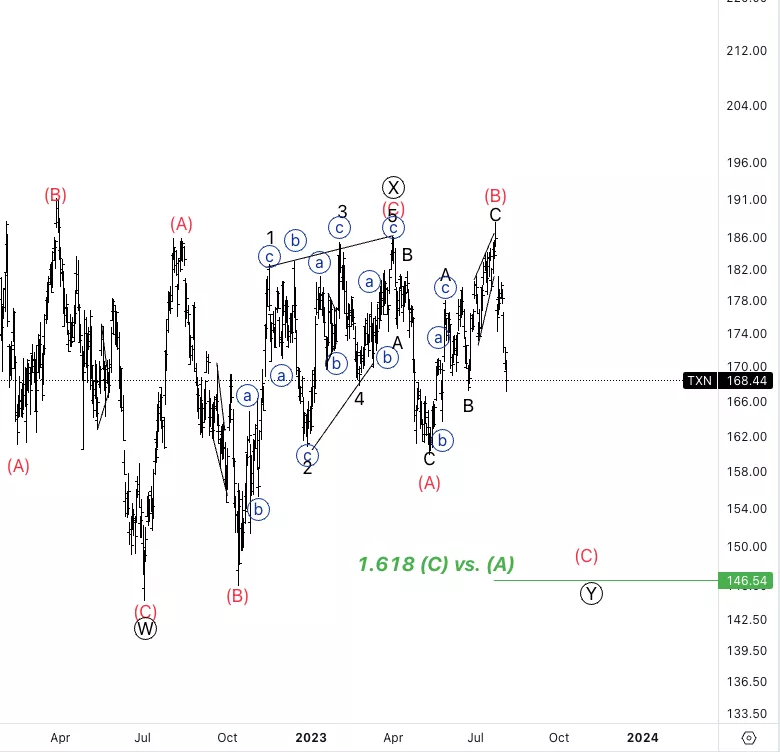
Texas Instruments Inc., Elliott Wave Technical Analysis

Texas Instruments Inc., (TXN): Daily Chart for Monday, August 7.
TXN Stock Market Analysis: We have been moving as expected, looking for much more downside to come into wave Y. Despite of what will happen, this sideways move seems corrective in nature, which is why I am expecting further downside.
TXN Elliott Wave Count: Wave 1 of (C).
TXN Technical Indicators: Above averages.
TXN Trading Strategy: Looking for shorts into wave 3 of (C).
TradingLounge Analyst: Alessio Barretta
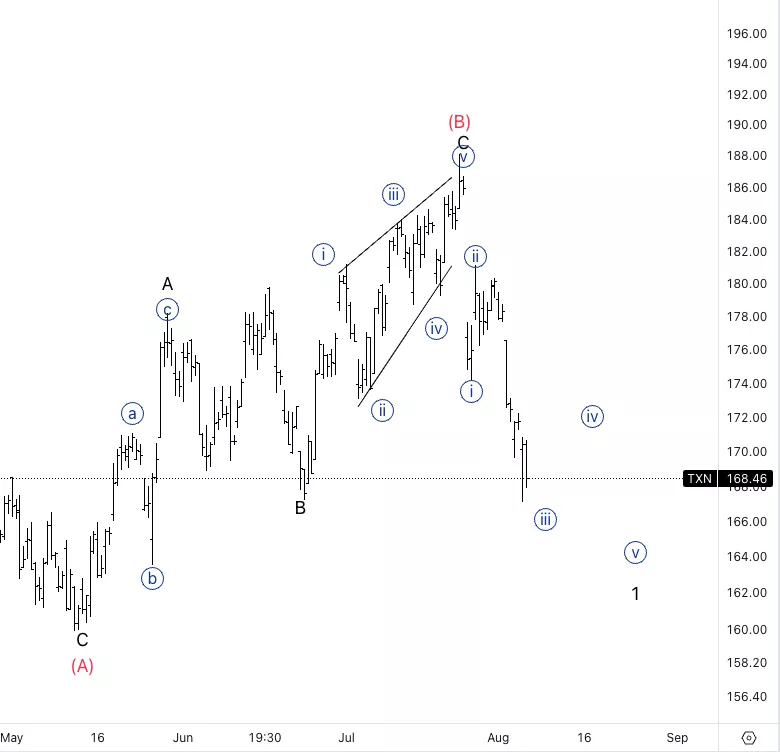
Texas Instruments Inc., TXN: 4-hour Chart, Monday, August 7.
Texas Instruments Inc., Elliott Wave Technical Analysis
TXN Stock Market Analysis: Looking for a series of threes and fours to complete wave 1. We could be looking for short term shorts into wave {v}.
TXN Elliott Wave count: Wave {iii} of 1.
TXN Technical Indicators: Below all averages.
TXN Trading Strategy: Looking for shorts into wave {v} if we get the pullback in wave {iv}.
More By This Author:
Elliott Wave Technical Analysis: Polkadot/U.S. Dollar (DOTUSD)
Nasdaq Technical Analysis: Wave 4 Completion In Sight, Traders Prepare For Opportunities
Elliott Wave Technical Analysis: Intuit Inc. - Friday, Aug. 4


Comments
Log in or sign up to join the conversation.