
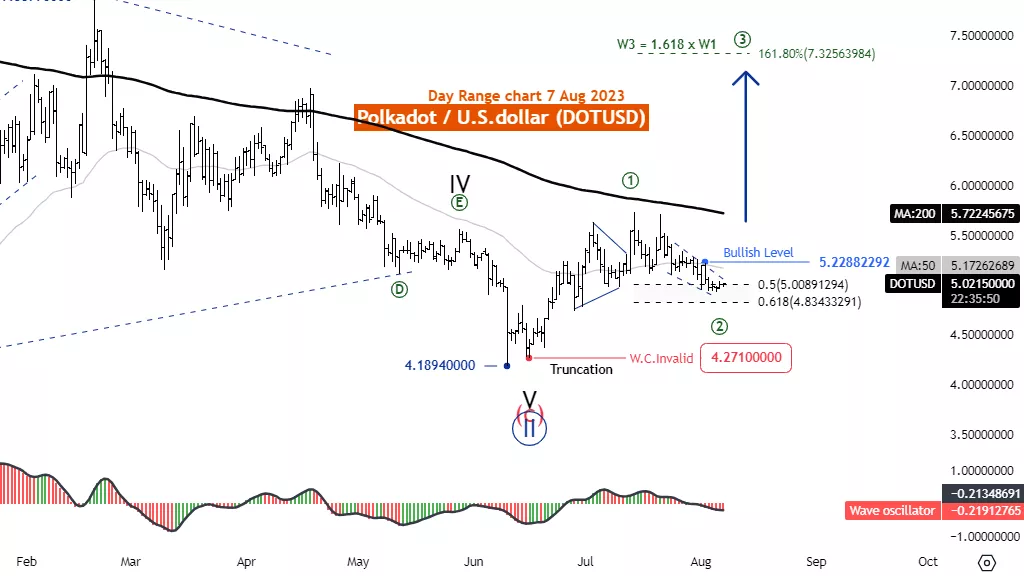
Elliott Wave Analysis Daily Chart, August 7, DOTUSD
Function: Reactionary(Counter Trend)
Mode: Corrective
Structure: Flat
Position: Wave (C)
Direction Next higher Degrees: wave ((2)) of Motive
Details: Retracement of wave ((2)) usually .50 or .618 x Length wave ((1))
Wave Cancel invalid level: 4.26
DOTUSD Trading Strategy: We are considering the Corrective of wave ((2)) green which usually finds retracement between 50 - 61.8% of Wave ((1)), When wave ((2)) ends the price increase again in wave ((3)) and the price rising above 5.228 is a signal for the new uptrend.
DOTUSD Technical Indicators: The price is below the MA200 indicating a Downtrend, Wave Oscillator = Bearish momentum.
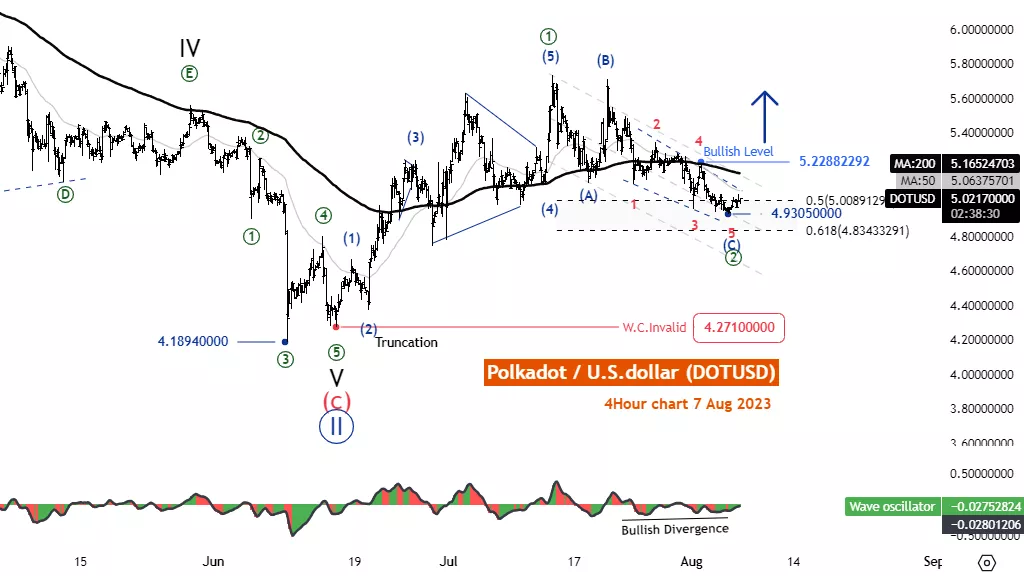
Elliott Wave Analysis 4H Chart, August 7, DOTUSD
Function: Reactionary(Counter Trend)
Mode: Corrective
Structure: Flat
Position: Wave (C)
Direction Next higher Degrees: wave ((2)) of Motive
Details: We are considering ending wave ((2)) from rising above 5.2288 level.
Wave Cancel invalid level: 4.26
DOTUSD Trading Strategy: we considering the Corrective of wave ((2)) green which usually retracement between 50 - 61.8% of Wave ((1)), When wave ((2)) End the price increase again in wave ((3)) and the price rising above 5.228 is a signal for the new uptrend.
DOTUSD Technical Indicators: The price is below the MA200 indicating a Downtrend, Wave Oscillator are Bearish momentum.
More By This Author:
Nasdaq Technical Analysis: Wave 4 Completion In Sight, Traders Prepare For Opportunities
Elliott Wave Technical Analysis: Intuit Inc. - Friday, Aug. 4
Elliott Wave Technical Analysis: NEO/U.S. Dollar - Friday, Aug. 4


Comments
Log in or sign up to join the conversation.