

Texas Instruments Inc., Elliott Wave Technical Analysis

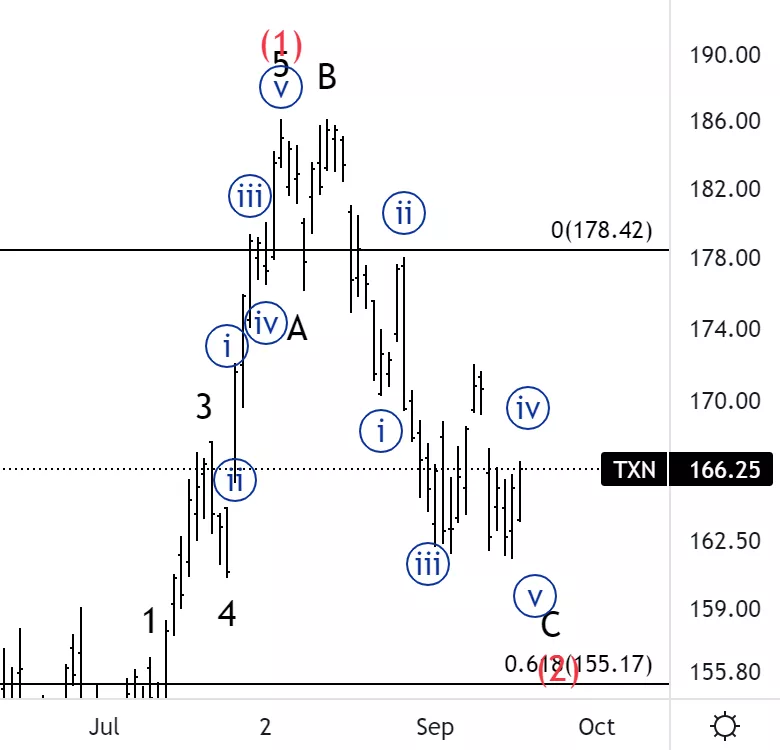
Texas Instruments Inc.,(TXN): Daily Chart, September 20 2022,
TXN Stock Market Analysis:Looking for one last move lower into wave {v} as we approach the end of the correction.
TXN Elliott Wave count: {v} of C.
TXN Trading StrategyLooking for shorts for one last push lower..
TXN Technical Indicators:The 20 EMA(red line) may act as resistance soon.
TradingLounge Analyst: Alessio Barretta
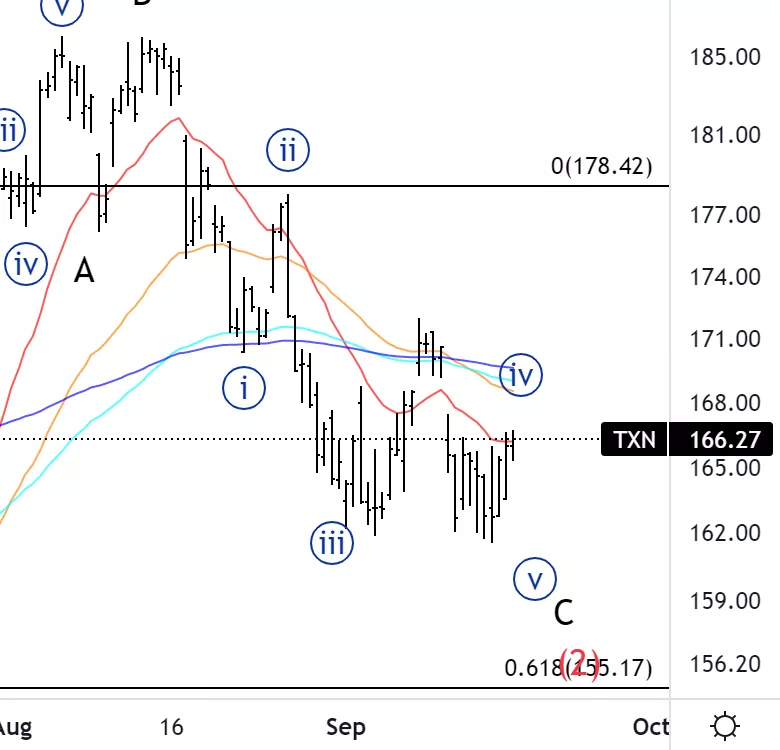
Texas Instruments Inc., TXN: 4-hour Chart, September 20 2022
Texas Instruments Inc., Elliott Wave Technical Analysis
TXN Stock Market Analysis: We could move just a bit higher before falling back lower into wave {v}.
TXN Elliott Wave count: {v} of C.
TXN Technical Indicators: 200EMA acting as resistance.
TXN Trading Strategy: Look for a bounce of the averages to then place shorts.
More By This Author:
Elliott Wave Technical Analysis: Dogecoin, Sept. 20
Elliott Wave Technical Analysis: Honeywell International Inc., Sept.19
ASX200 Elliott Wave Analysis | The Bigger Picture Wave Count



Comments
Log in or sign up to join the conversation.