
Honeywell International Inc., Elliott Wave Technical Analysis
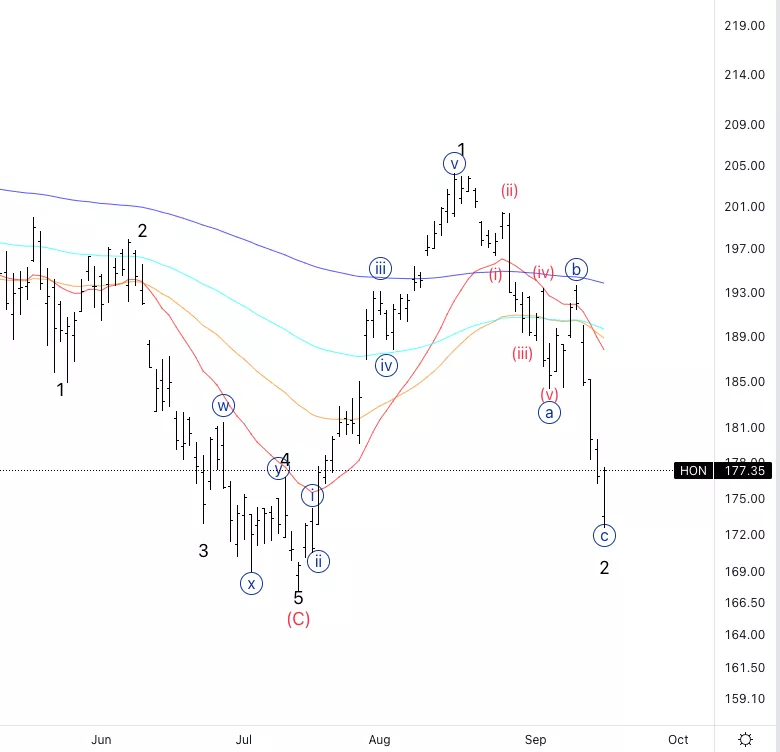
Honeywell International Inc., (HON): Daily Chart, September 19 2022,
HON Stock Market Analysis: Moving as expected, we have a deep wave 2 which often times is the usual. At this point we need to start moving higher or else the count will most likely be invalidated.
HON Elliott Wave count: {c} of 2
HON Trading Strategy:Looking for a bounce in wave {i} to then place longs.
HON Technical Indicators: The RSI has reached oversold territory as well as the MACD.
TradingLounge Analyst: Alessio Barretta
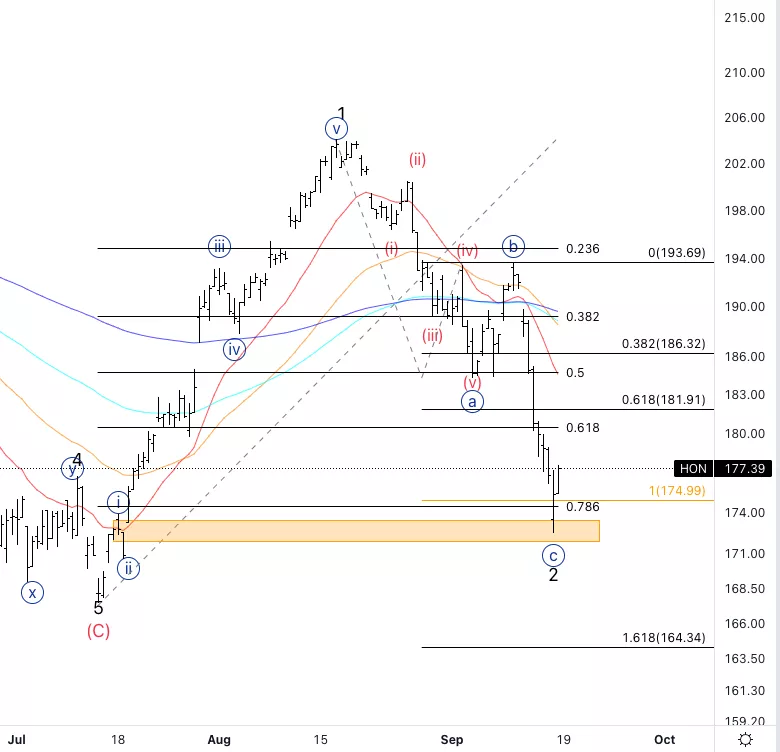
Honeywell International Inc., HON: 4-hour Chart, September 19 2022
Honeywell International Inc., Elliott Wave Technical Analysis
HON Stock Market Analysis: We nicely filled the gap on the left, represented by the highlighted rectangle. We also reached the 78.6% net retracement as well as past equality of {a} and {c}, highlighted by the orange line.
HON Elliott Wave count: {c} of 2.
HON Technical Indicators: Stating to form bullish RSI divergence
HON Trading Strategy: Look for a clear five waves up into wave {i} to then look for longs.
More By This Author:
Elliott Wave Analysis: FANG And Fin, Sept. 19
Elliott Wave Technical Analysis: Cardano, Sept. 19
Bitcoin Elliott Wave | BTC Bounce Off $19,000 Then Down


Comments
Log in or sign up to join the conversation.