

Starbucks Inc., Elliott Wave Technical Analysis
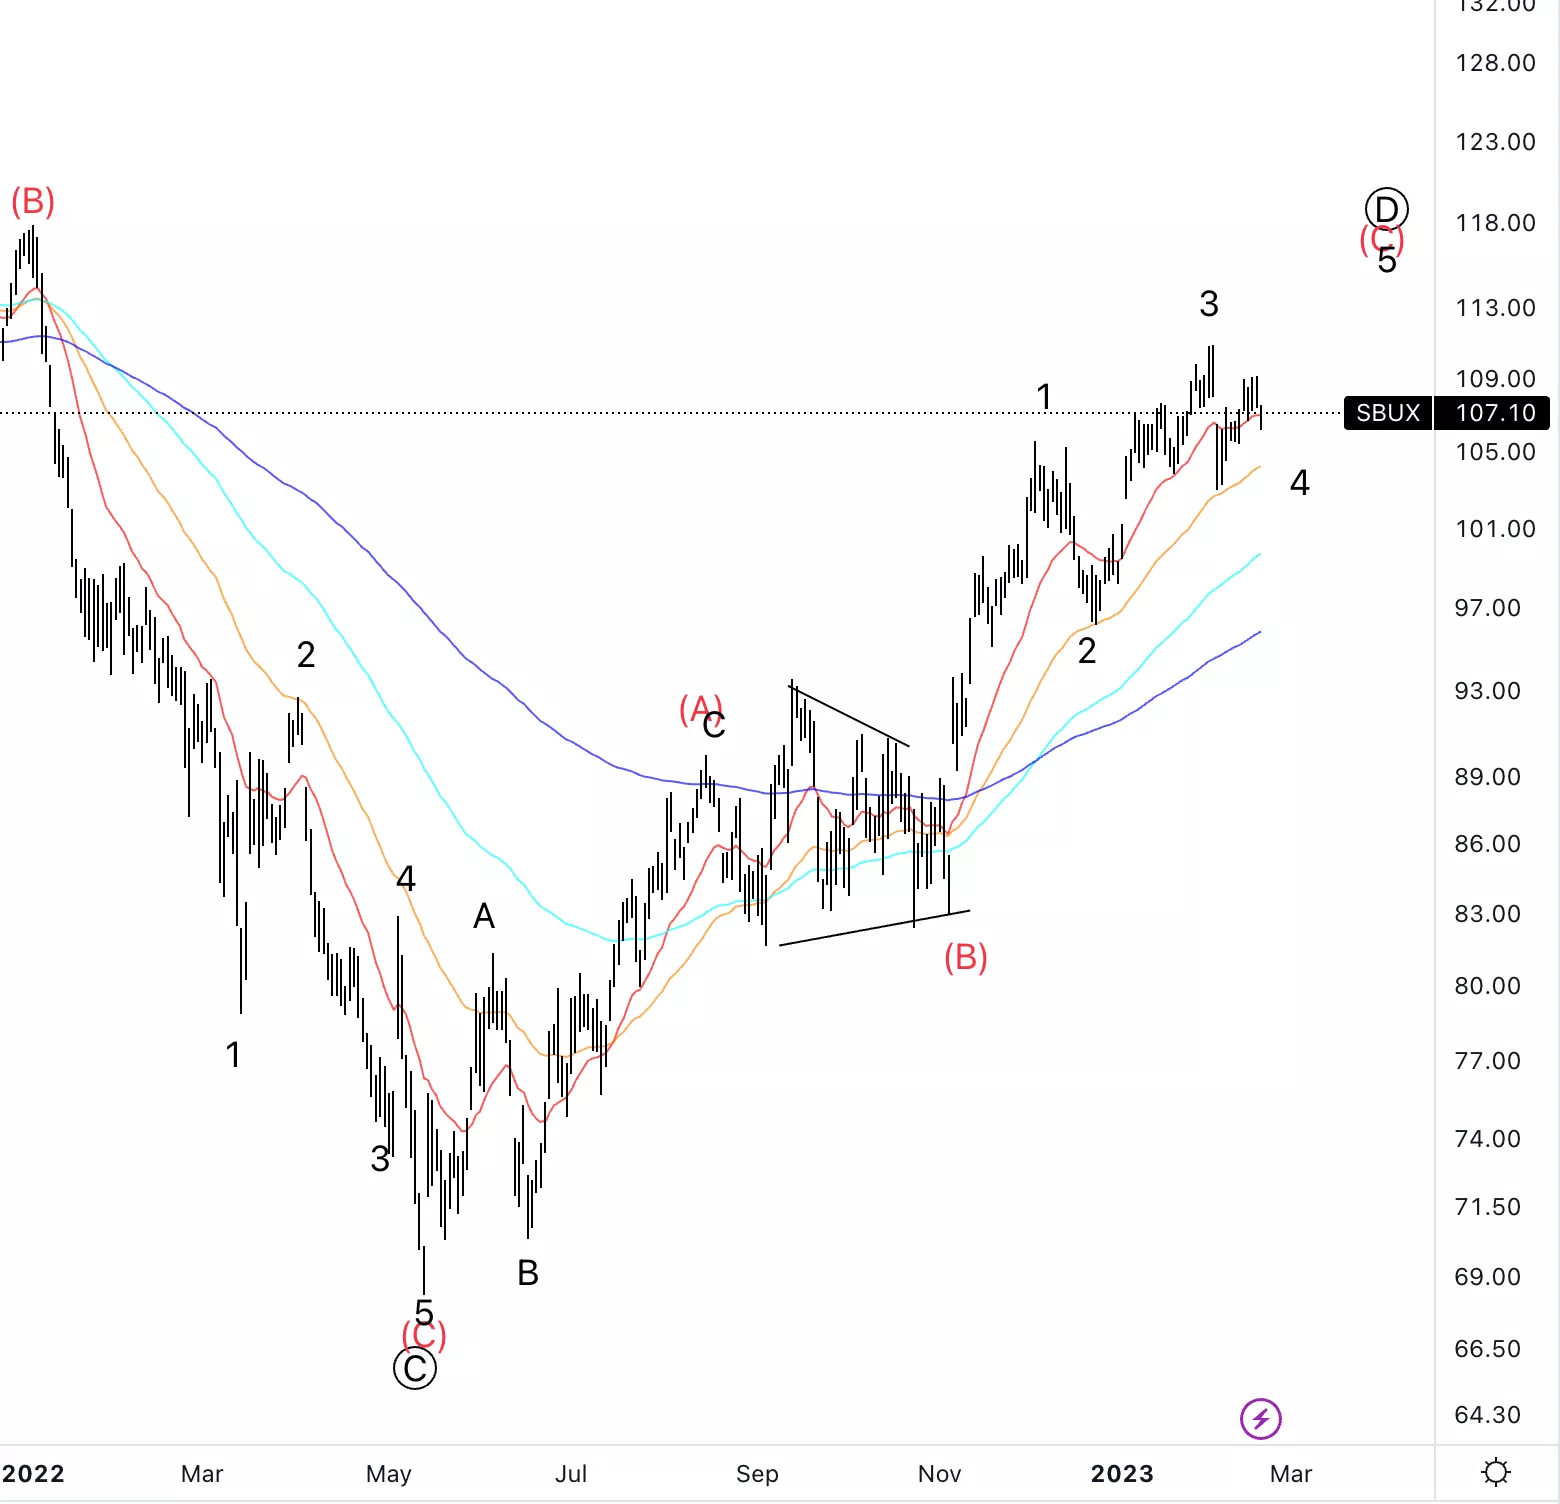
Starbucks Inc., (Nasdaq: SBUX): Daily Chart, 20 February 2023.
SBUX Stock Market Analysis: Looking for a three wave move to be part of wave D of a higher degree triangle in wave IV. It looks like we are at the final stages of wave (C).
SBUX Elliott Wave Count: Wave 4 of (C).
SBUX Technical Indicators: 20EMA as support.
SBUX Trading Strategy: Looking for long into wave 5 as wave 4 should hold.
Analyst: Alessio Barretta
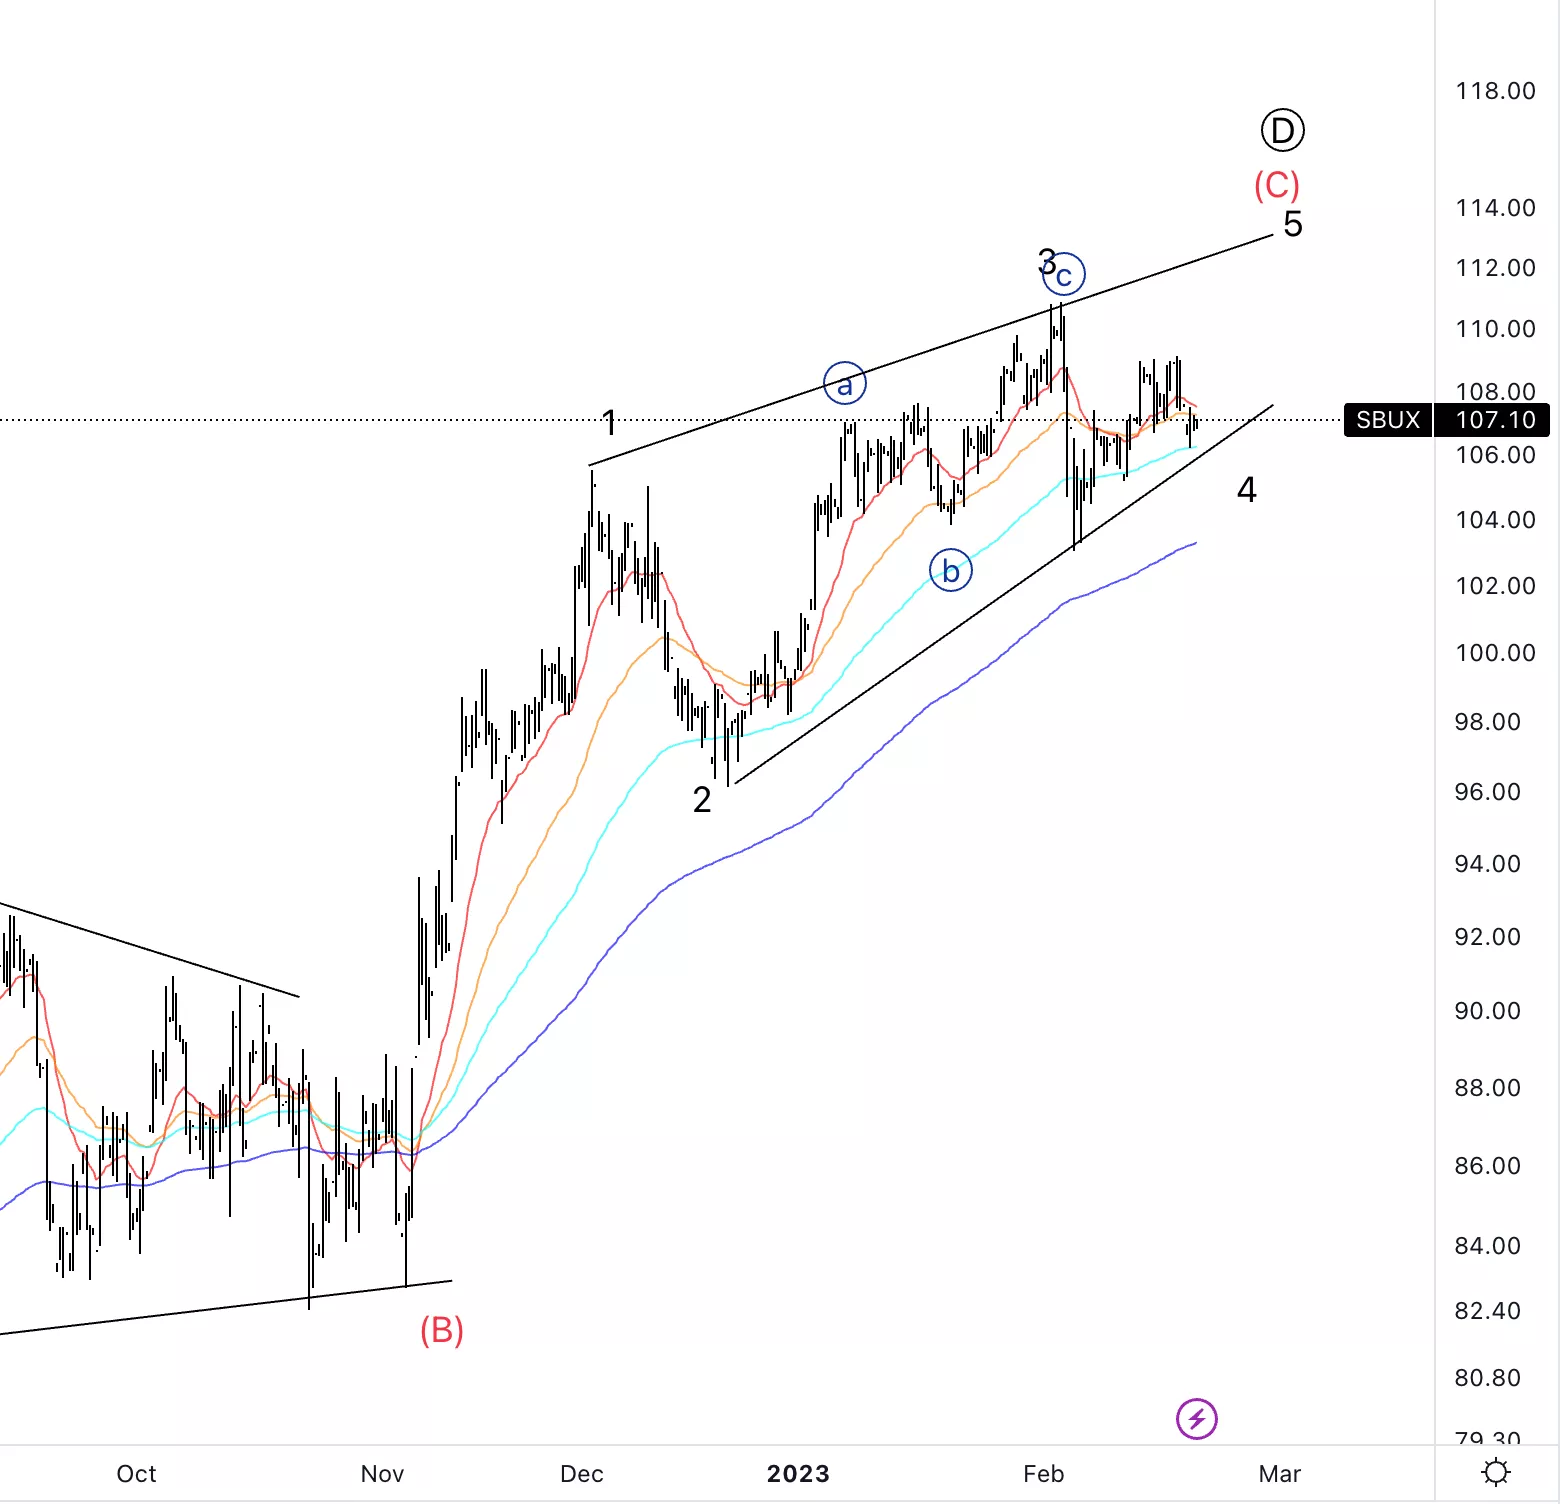
Starbucks Inc., SBUX: 4-hour Chart, 20 February 2023.
Starbucks Inc., Elliott Wave Technical Analysis
SBUX Stock Market Analysis: Looking for a sideways wave 4 to alternate with the sharp wave 2. Looking for further upside in wave 5.
SBUX Elliott Wave count: Wave 4 of (C).
SBUX Technical Indicators: 20EMA as support.
SBUX Trading Strategy: Looking for long into wave 5 as wave 4 should hold.
More By This Author:
US Stock Market Correction Continues: Lower Prices In Play
Elliott Wave Technical Analysis: Theta Token/USD, Monday, Feb. 20
Elliott Wave Technical Analysis: Okta Inc.



Comments
Log in or sign up to join the conversation.