

QUALCOMM Inc. (QCOM) Elliott Wave Analysis – Trading Lounge
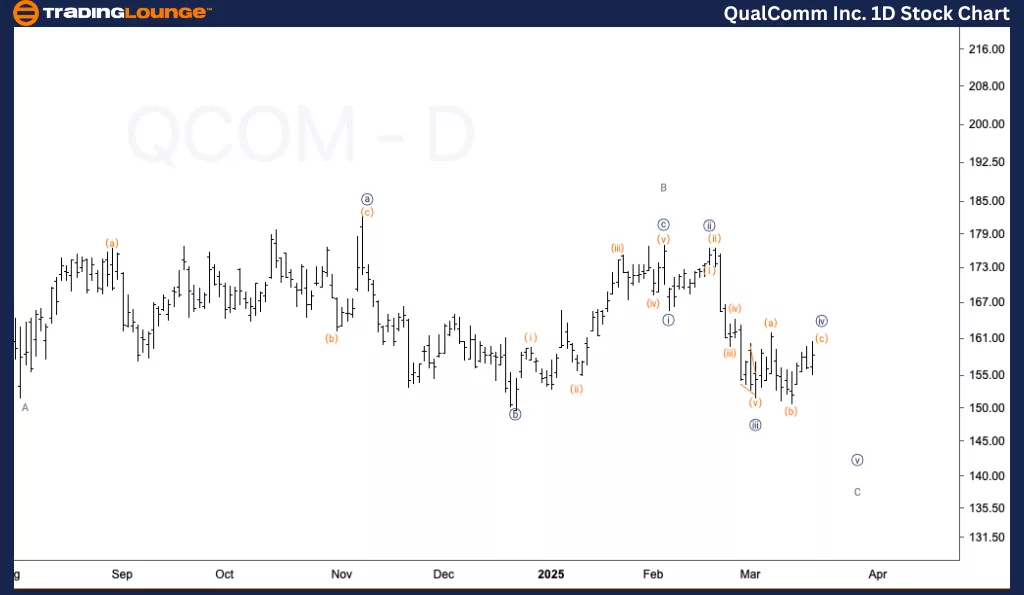
QCOM Elliott Wave Technical Analysis – Daily Chart
Function: Counter-Trend
Mode: Corrective
Structure: Zigzag
Position: Wave C of (4)
Direction: Downside into Wave (C)
Details:
Expecting further downside in Wave C of (4) as the five-wave structure is incomplete.
Currently, Wave C is only a three-wave move, suggesting one more leg lower to complete the count.
Resistance is identified at $165, and failure to break above this level would confirm the continuation of the downtrend.
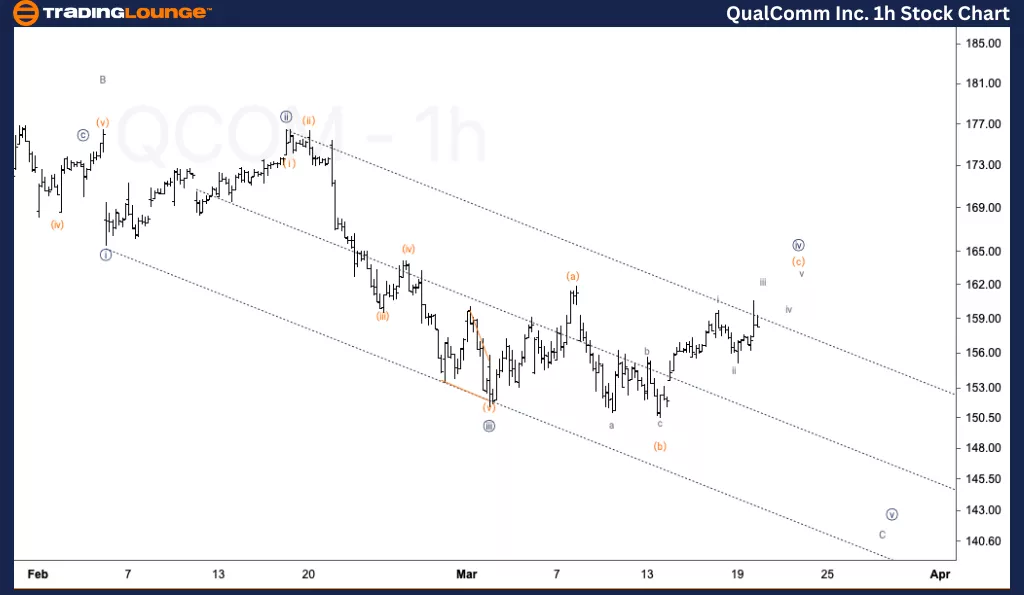
QCOM Elliott Wave Technical Analysis – 1H Chart
Function: Counter-Trend
Mode: Corrective
Structure: Zigzag
Position: Wave (c) of {iv}
Direction: Nearing a top in Wave (c)
Details:
Watching for a potential ending diagonal in Wave (c) before resuming the downtrend into Wave {v}.
Current price action is interacting with the temporary base channel, adding further confirmation to the analysis.
Conclusion
This Elliott Wave analysis of key stocks provides a comprehensive market outlook for traders. Monitoring price movements, key resistance levels, and wave structures will help traders align their strategies with market trends.
Technical Analyst: Alessio Barretta
More By This Author:
Elliott Wave Technical Forecast: Newmont Corporation - Thursday, March 20
Elliott Wave Technical Analysis: Euro/U.S. Dollar - Thursday, March 20
Elliott Wave Technical Analysis: AAVE Crypto Price Today



Comments
Log in or sign up to join the conversation.