
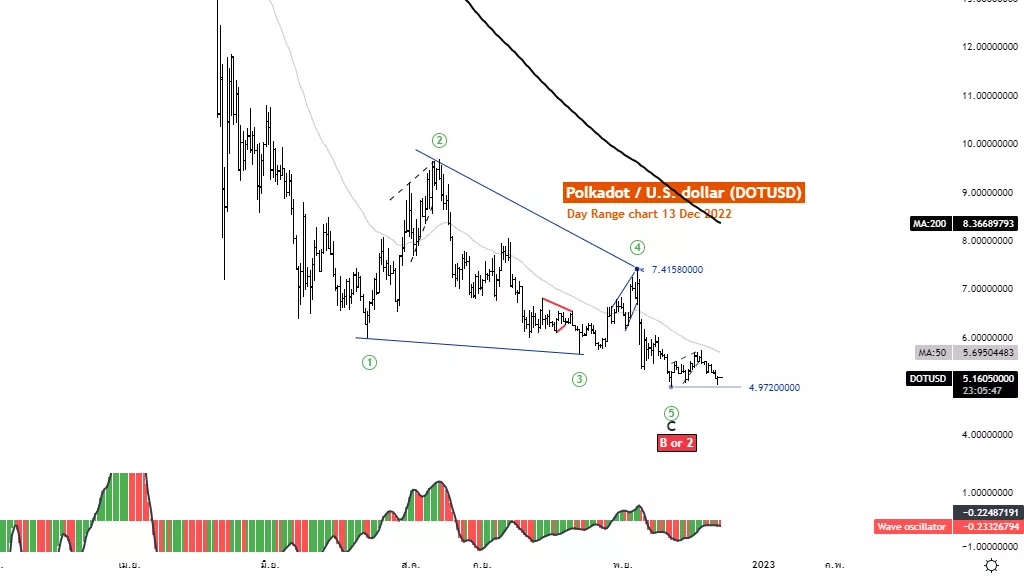
Elliott Wave Analysis TradingLounge Daily Chart, December 13, 2022.

Polkadot / U.S. Dollar (DOT-X)
DOTUSD Elliott Wave Technical Analysis
Function: Follow trend
Mode: Motive
Structure: Diagonal
Position: Wave 5
Direction Next higher Degrees: Sub-wave of Wave C
Details: wave 5 in diagonal is likely to end at the level of 4.972
Wave Cancel invalid level:4.972
Polkadot / U.S. dollar (DOTUSD)Trading Strategy: Polkadot is still under selling pressure as it remains below MA200 and MA50, but showing signs of recovery from the 4.972 level, but selling pressure remains. But even so, as we believe, the price structure in the downtrend has already ended at the level of 4.972, if it falls below, An idea in an uptrend will be broken.
Polkadot / U.S. dollar (DOTUSD) Technical Indicators: The price is below the MA200 MA50,indicating a downtrend. The wave oscillators below Zero-Line momentum are bearish
TradingLounge Analyst: Kittiampon Somboonsod
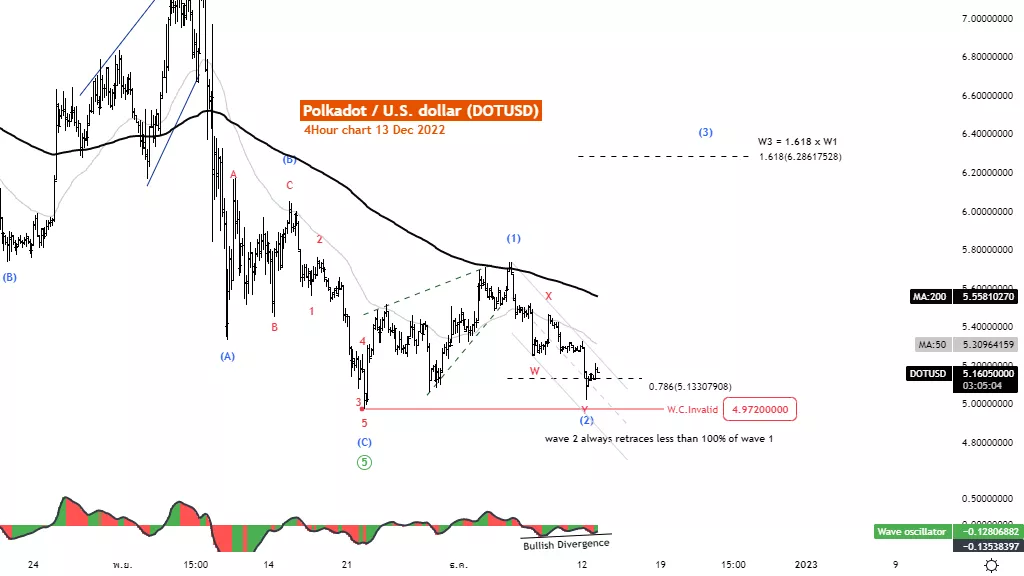
Elliott Wave Analysis TradingLounge 4H Chart, December 13, 2022.
Polkadot / U.S. dollar (DOTUSD)
DOTUSD Elliott Wave Technical Analysis
Function: Follow trend
Mode: Motive
Structure: Diagonal
Position: Wave 5
Direction Next higher Degrees: Sub-wave of Wave C
Details: wave 5 in diagonal is likely to end at the level of 4.972
Wave Cancel invalid level:4.972
Polkadot / U.S. dollar (DOTUSD)Trading Strategy: Polkadot is still under selling pressure as it remains below MA200 and MA50, but showing signs of recovery from the 4.972 level, but selling pressure remains. But even so, as we believe, the price structure in the downtrend has already ended at the level of 4.972, if it falls below, An idea in an uptrend will be broken.
Polkadot / U.S. dollar (DOTUSD) Technical Indicators: The price is below the MA200 MA50,indicating a downtrend. The wave oscillators below Zero-Line momentum are bearish.
More By This Author:
Elliott Wave Technical Analysis: United Parcel Service Inc., Daily Chart, Monday, Dec. 12
Chainlink / U.S.dollar(LINKUSD) Elliott Wave Technical Analysis 12 December 2022
Elliott Wave Technical Analysis: Analog Devices Inc. - Friday, Dec. 9


Comments
Log in or sign up to join the conversation.