
United Parcel Service Inc., Elliott Wave Technical Analysis

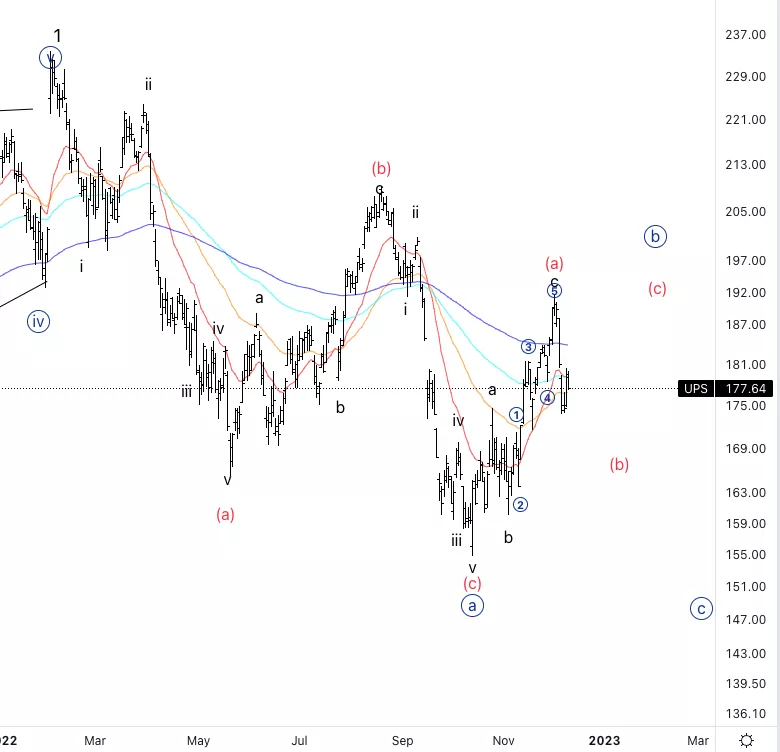
United Parcel Service Inc., (UPS): Daily Chart, December 12 2022,
UPS Stock Market Analysis: UPS has been moving as expected from the last update. We are looking at a move off the $155 lows as a corrective move, being a three wave structure. We are not forecasting either a three wave move or a triangle in wave (b).
UPS Elliott Wave Count: Wave (b) of {b}.
UPS Technical Indicators: Averages are crossing, 20EMa acting as resistance.
UPS Trading Strategy: Look for short term short and then wait for a clearer picture on how wave{b} is going to look like.
TradingLounge Analyst: Alessio Barretta
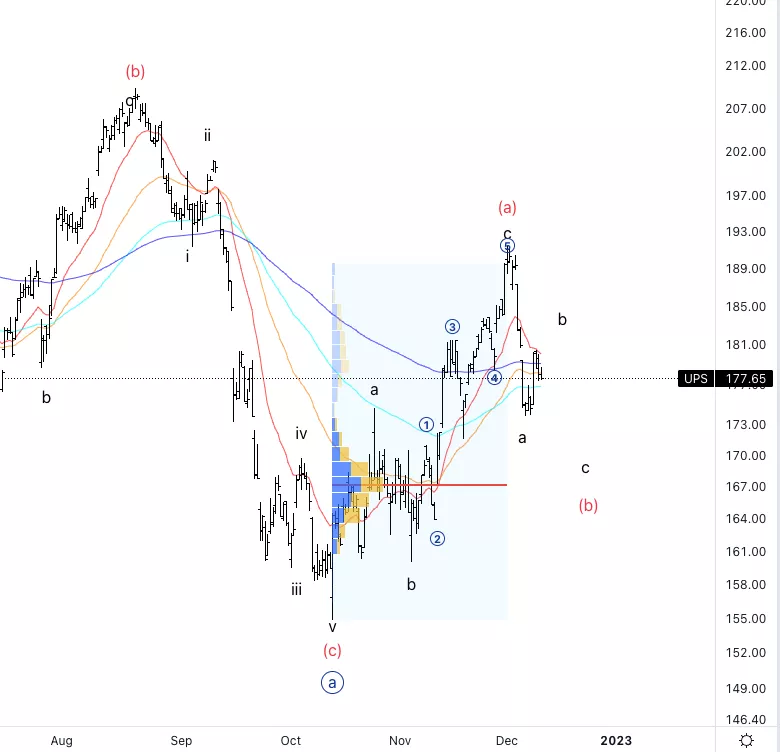
United Parcel Service Inc. ,UPS: 4-hour Chart, December 12 2022
United Parcel Service Inc., Elliott Wave Technical Analysis
UPS Stock Market Analysis: We could potentially have finished wave a and be in wave b of (b).However the initial move up in potential wave b seems to be a three wave move and therefore we could still break the low of wave a. Support could be faced at around 167$ where we have large volume from the previous up swing.
UPS Elliott Wave count: Wave b of (b).
UPS Technical Indicators: 20EMA acting as resistance.
UPS Trading Strategy: Looking for shorts, potentially up to 167$.
More By This Author:
Chainlink / U.S.dollar(LINKUSD) Elliott Wave Technical Analysis 12 December 2022
Elliott Wave Technical Analysis: Analog Devices Inc. - Friday, Dec. 9
Elliott Wave Analysis: Commodity Futures Markets


Comments
Log in or sign up to join the conversation.