


Photo by Maxim Hopman on Unsplash
Phreesia Inc., Elliott Wave Technical Analysis
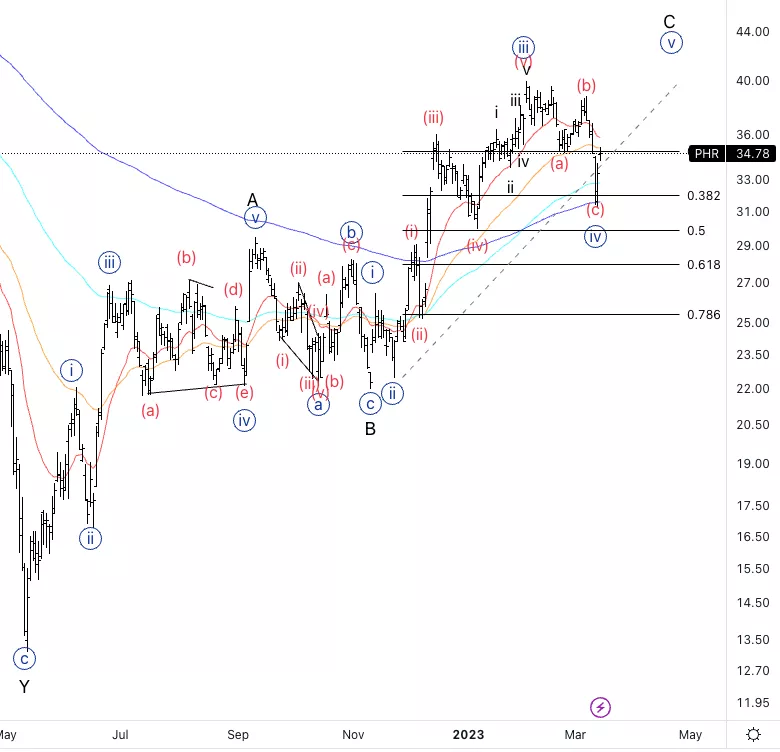
Phreesia Inc., (Nasdaq: PHR): Daily Chart, 15 March 2023.
PHR Stock Market Analysis: Looking for resumption of the uptrend in wave {v} as we can identify a three wave move into wave {iv}. Alternatively, we could be in a wave 4 if wave A was wave 1 instead.
PHR Elliott Wave Count: Wave {iv} of C.
PHR Technical Indicators: Support on the 200EMA.
PHR Trading Strategy: Looking for a break of wave (b) to have further confirmation.
Analyst: Alessio Barretta
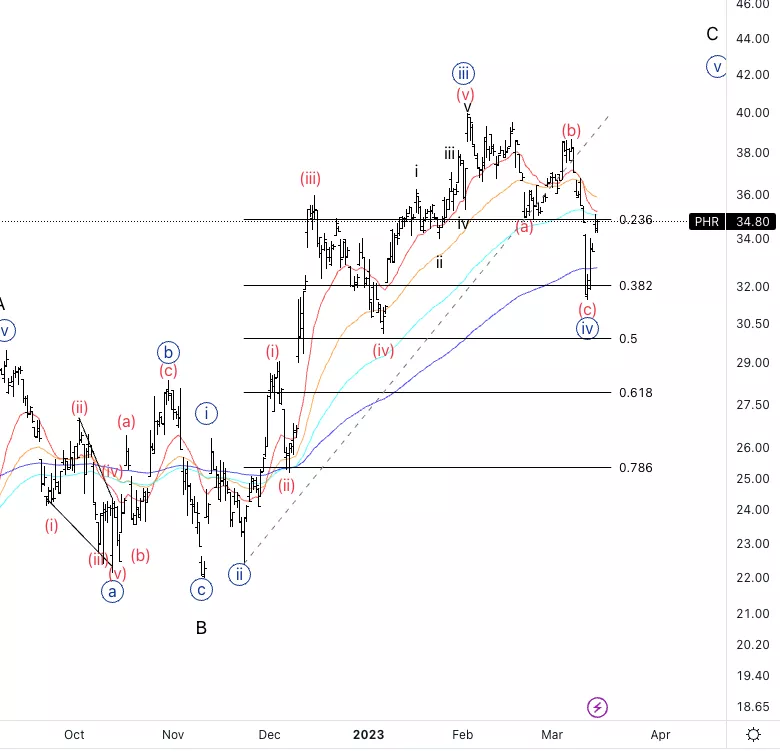
Phreesia Inc., PHR: 4-hour Chart, 15 March 2023.
Phreesia Inc., Elliott Wave Technical Analysis
PHR Stock Market Analysis: We can see how we reacted off the 38.2% of wave {iii} which is typical for a wave {iv} as well as it found support near wave (iv) of one lesser degree.
PHR Elliott Wave count: Wave (c) of {iv}.
PHR Technical Indicators: Support on the 200EMA.
PHR Trading Strategy: Looking for a break of wave (b) to have further confirmation.
More By This Author:
Elliott Wave Technical Analysis: Ethereum, Wednesday, March 15
Elliott Wave Technical Analysis: Block Inc. - Tuesday, March 14
Elliott Wave Technical Analysis: AAVE Token / U.S. Dollar - Tuesday, March 14



Comments
Log in or sign up to join the conversation.