

Image Source: Unsplash
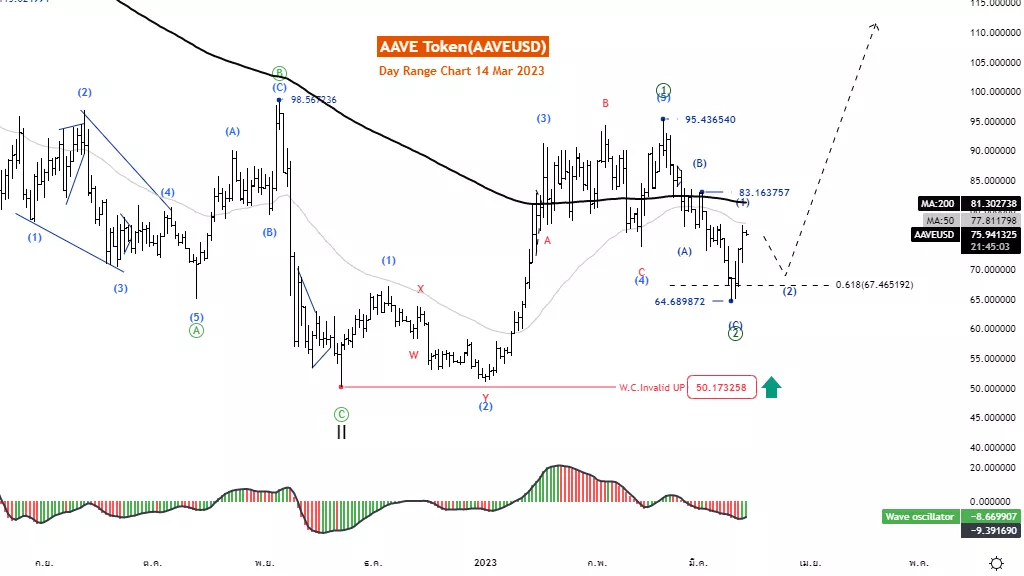
Elliott Wave Analysis TradingLounge Daily Chart, 14 March 2023.
AAVE Token/U.S. Dollar(AAVEUSD)
AAVEUSD Elliott Wave Technical Analysis
Function: Counter trend
Mode: Corrective
Structure: Zigzag
Position: Wave (C)
Direction Next higher Degrees: Wave ((2)) of Motive
Details: Wave (C) is likely to end at 64.689 and a five-wave rise. This level will help confirm
Wave Cancel invalid Level: 50.173
AAVE Token/U.S. Dollar (AAVEUSD) Trading Strategy: AAVE Token has recovered well from 64.689, a level sufficient to create a second wave reversal. And the five-up supports this idea. But even so, the price still remained below the MA200 line, making the overall picture still in a downtrend. This may cause the price to pull back in the short term before rising again.
AAVE Token/U.S. Dollar (AAVEUSD) Technical Indicators: The price is below the MA200 indicating a downtrend. The wave oscillators below Zero-Line momentum are bearish.
Analyst: Kittiampon Somboonsod, CEWA
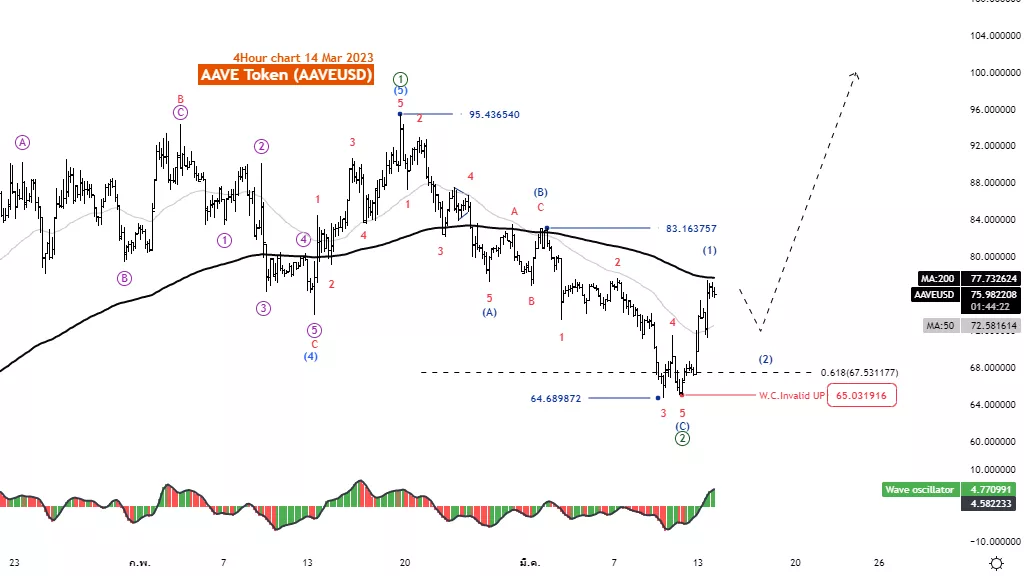
Elliott Wave Analysis TradingLounge 4H Chart, 14 March 2023.
AAVE Token/U.S. Dollar(AAVEUSD)
AAVEUSD Elliott Wave Technical Analysis
Function: Counter trend
Mode: Corrective
Structure: Zigzag
Position: Wave (C)
Direction Next higher Degrees: Wave ((2)) of Motive
Details: Wave (C) is likely to end at 64.689 and a five-wave rise. This level will help confirm
Wave Cancel invalid Level: 50.173
AAVE Token/U.S. Dollar (AAVEUSD) Trading Strategy: AAVE Token has recovered well from 64.689, a level sufficient to create a second wave reversal. And the five-up supports this idea. But even so, the price still remained below the MA200 line, making the overall picture still in a downtrend. This may cause the price to pull back in the short term before rising again.
AAVE Token/U.S. Dollar (AAVEUSD) Technical Indicators: The price is below the MA200 indicating a downtrend The wave oscillators above Zero-Line momentum are bullish.
More By This Author:
Elliott Wave Technical Analysis: 10x Genomics
Elliott Wave Technical Analysis: Bitcoin, Monday, March 13
Elliott Wave Technical Analysis: Shopify Inc.


Comments
Log in or sign up to join the conversation.