

Image Source: Pixabay
Phreesia Inc., Elliott Wave Technical Analysis
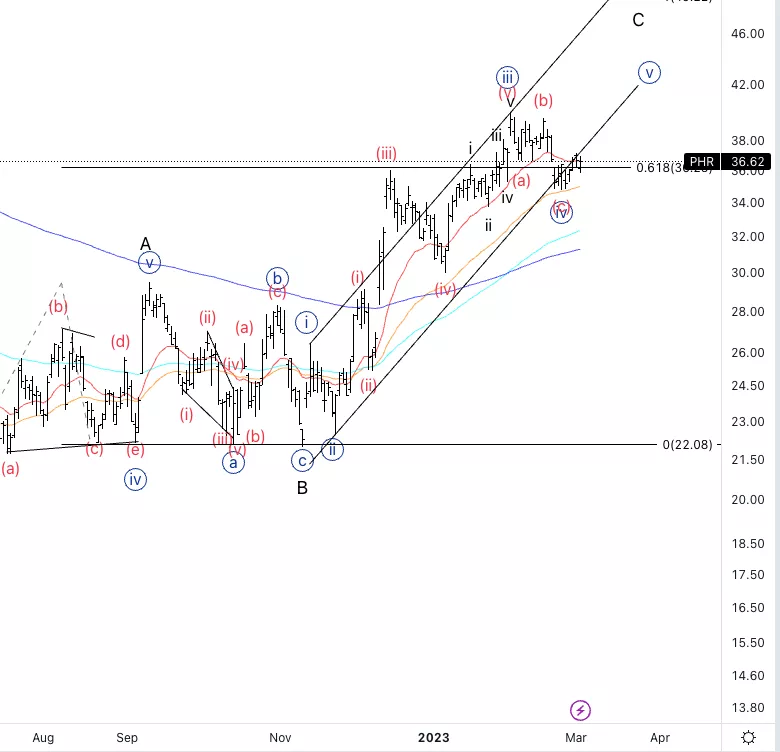
Phreesia Inc., (Nasdaq: PHR): Daily Chart, 3 March 2023.
PHR Stock Market Analysis: Moving higher into wave C as we are targeting equality of C vs. A. Looking for one last move up into wave {v}.
PHR Elliott Wave Count: Wave {iv} of C.
PHR Technical Indicators: Around the 20EMA.
PHR Trading Strategy: Looking for a bottom in wave {iv} already in place, to target further upside.
Analyst: Alessio Barretta
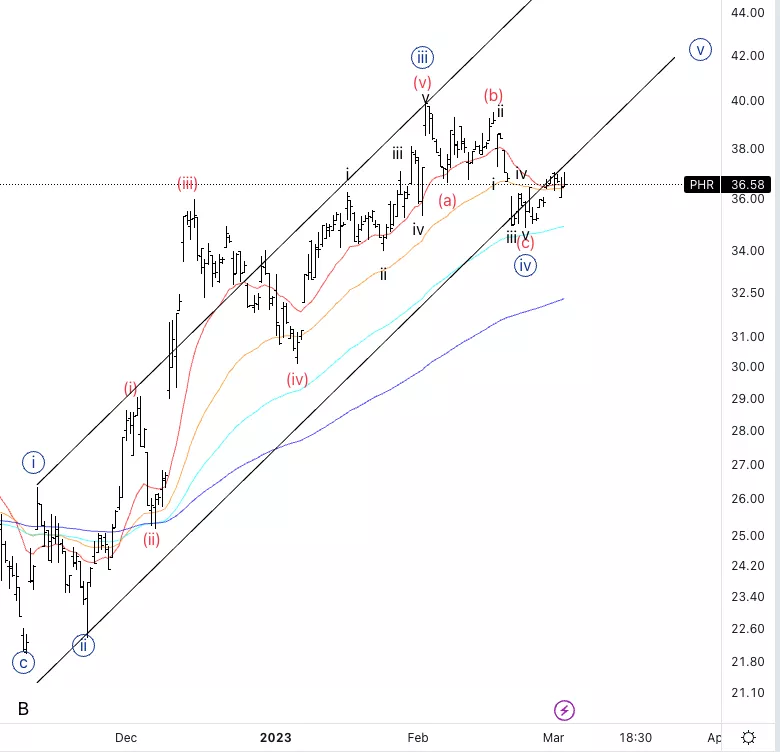
Phreesia Inc., PHR: 4-hour Chart, 3 March 2023.
Phreesia Inc., Elliott Wave Technical Analysis
PHR Stock Market Analysis: It looks like we can identify five waves down into wave (c) a shown. So we could be starting to move higher into wave (i) of {v}.
PHR Elliott Wave count: Wave (i) of {v}.
PHR Technical Indicators: Above all averages, 20EMA as support.
PHR Trading Strategy: Looking for a clear five wave move to then look for longs.
More By This Author:
Elliott Wave Technical Analysis: Cardano / U.S. Dollar
Major Stock Indices Elliott Wave Trading Strategies
Elliott Wave Technical Analysis: O'Reilly Automotive Inc.


Comments
Log in or sign up to join the conversation.