

Image Source: Pixabay
PepsiCo Inc., Elliott Wave Technical Analysis
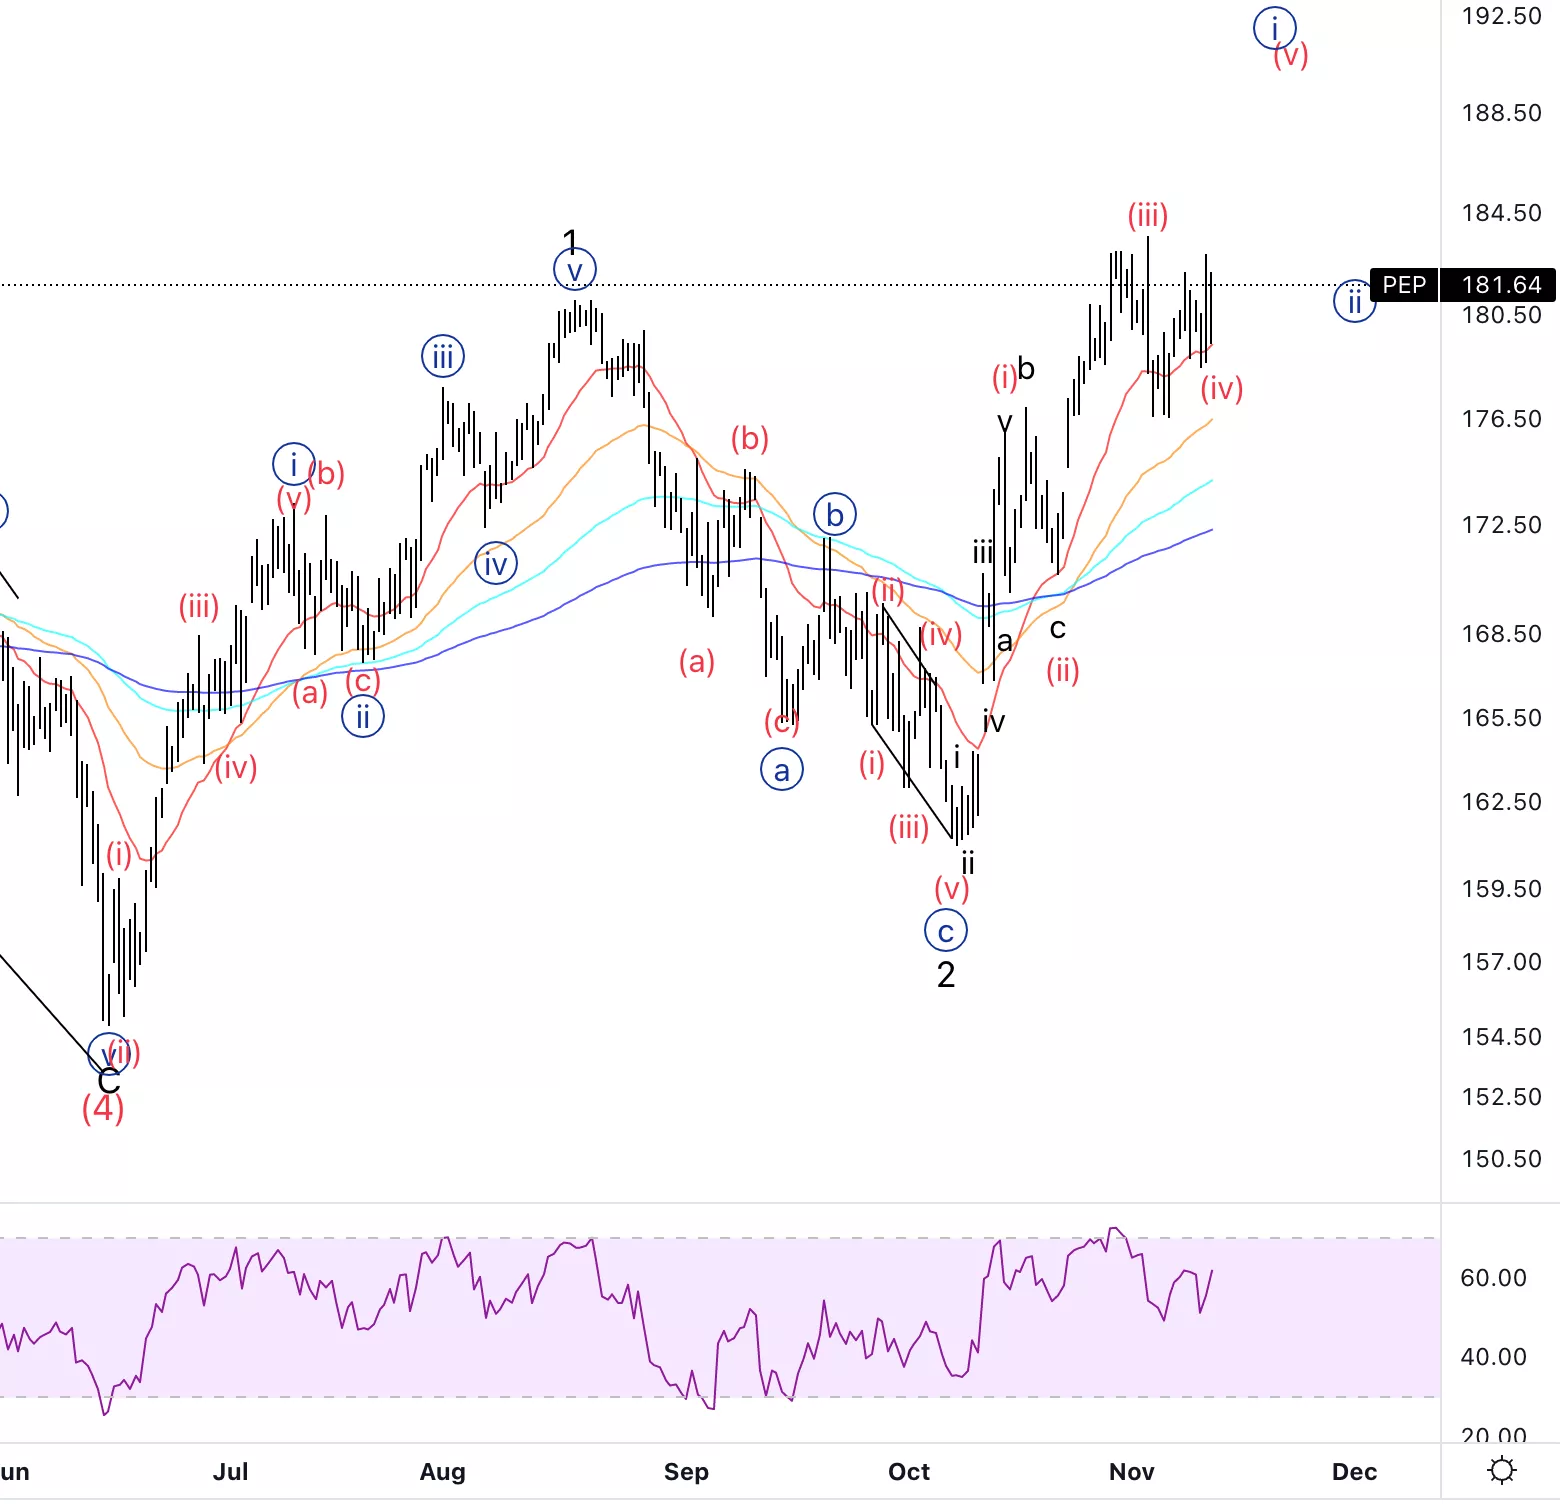
PepsiCo Inc., (Nasdaq: PEP): Daily Chart, November 11, 2022,
PEP Stock Market Analysis: Looking for five subwaves within wave {i} of 3. It looks like we have further upside left into wave (v) as we start to move sideways for wave (iv).
PEP Elliott Wave Count: Wave (iv) of {i}.
PEP Technical Indicators: Using the 20EMA as support.
PEP Trading Strategy: Waiting for wave {ii} to place long-term longs.
Analyst: Alessio Barretta
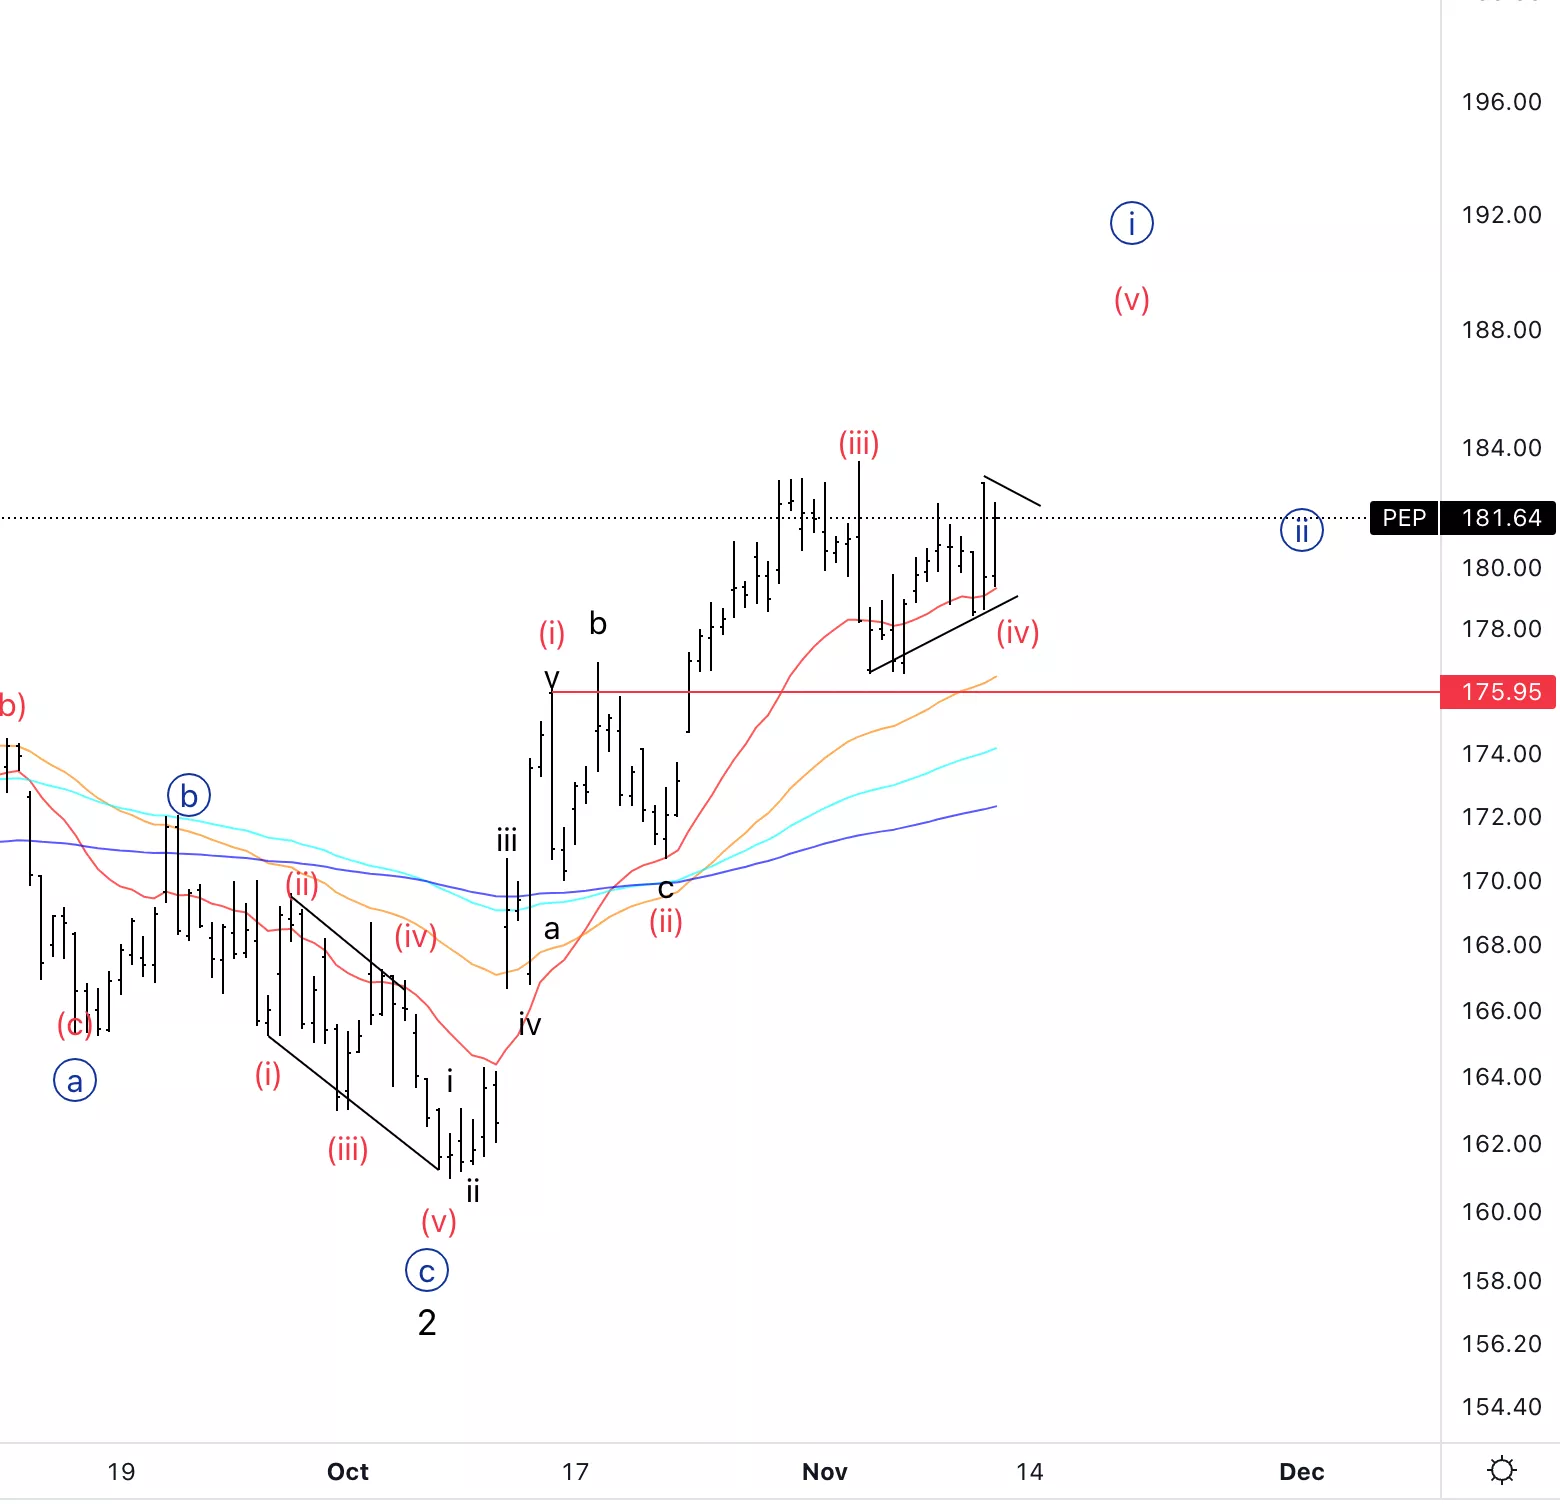
PepsiCo Inc., PEP: 4-hour Chart, November 11, 2022
PepsiCo Inc., Elliott Wave Technical Analysis
PEP Stock Market Analysis: Looking for wave (iv) to come to an end soon, potentially we could develop into a triangle, the invalidation level is a break south of the red line at 176$.
PEP Elliott Wave count: Wave (iv) of {i}.
PEP Technical Indicators: Above all EMAs and RSI is starting to form bearish divergence.
PEP Trading Strategy: Placing longs with a stop below the red line, looking for a short and potentially quick upmove in wave (v).
More By This Author:
Elliott Wave Technical Analysis: Bitcoin Prediction
U.S Stock Market Elliott Wave Analysis
Elliott Wave Technical Analysis: Biogen Inc. - Thursday, Nov. 10


Comments
Log in or sign up to join the conversation.