

Image Source: Pixabay
Biogen Inc., Elliott Wave Technical Analysis
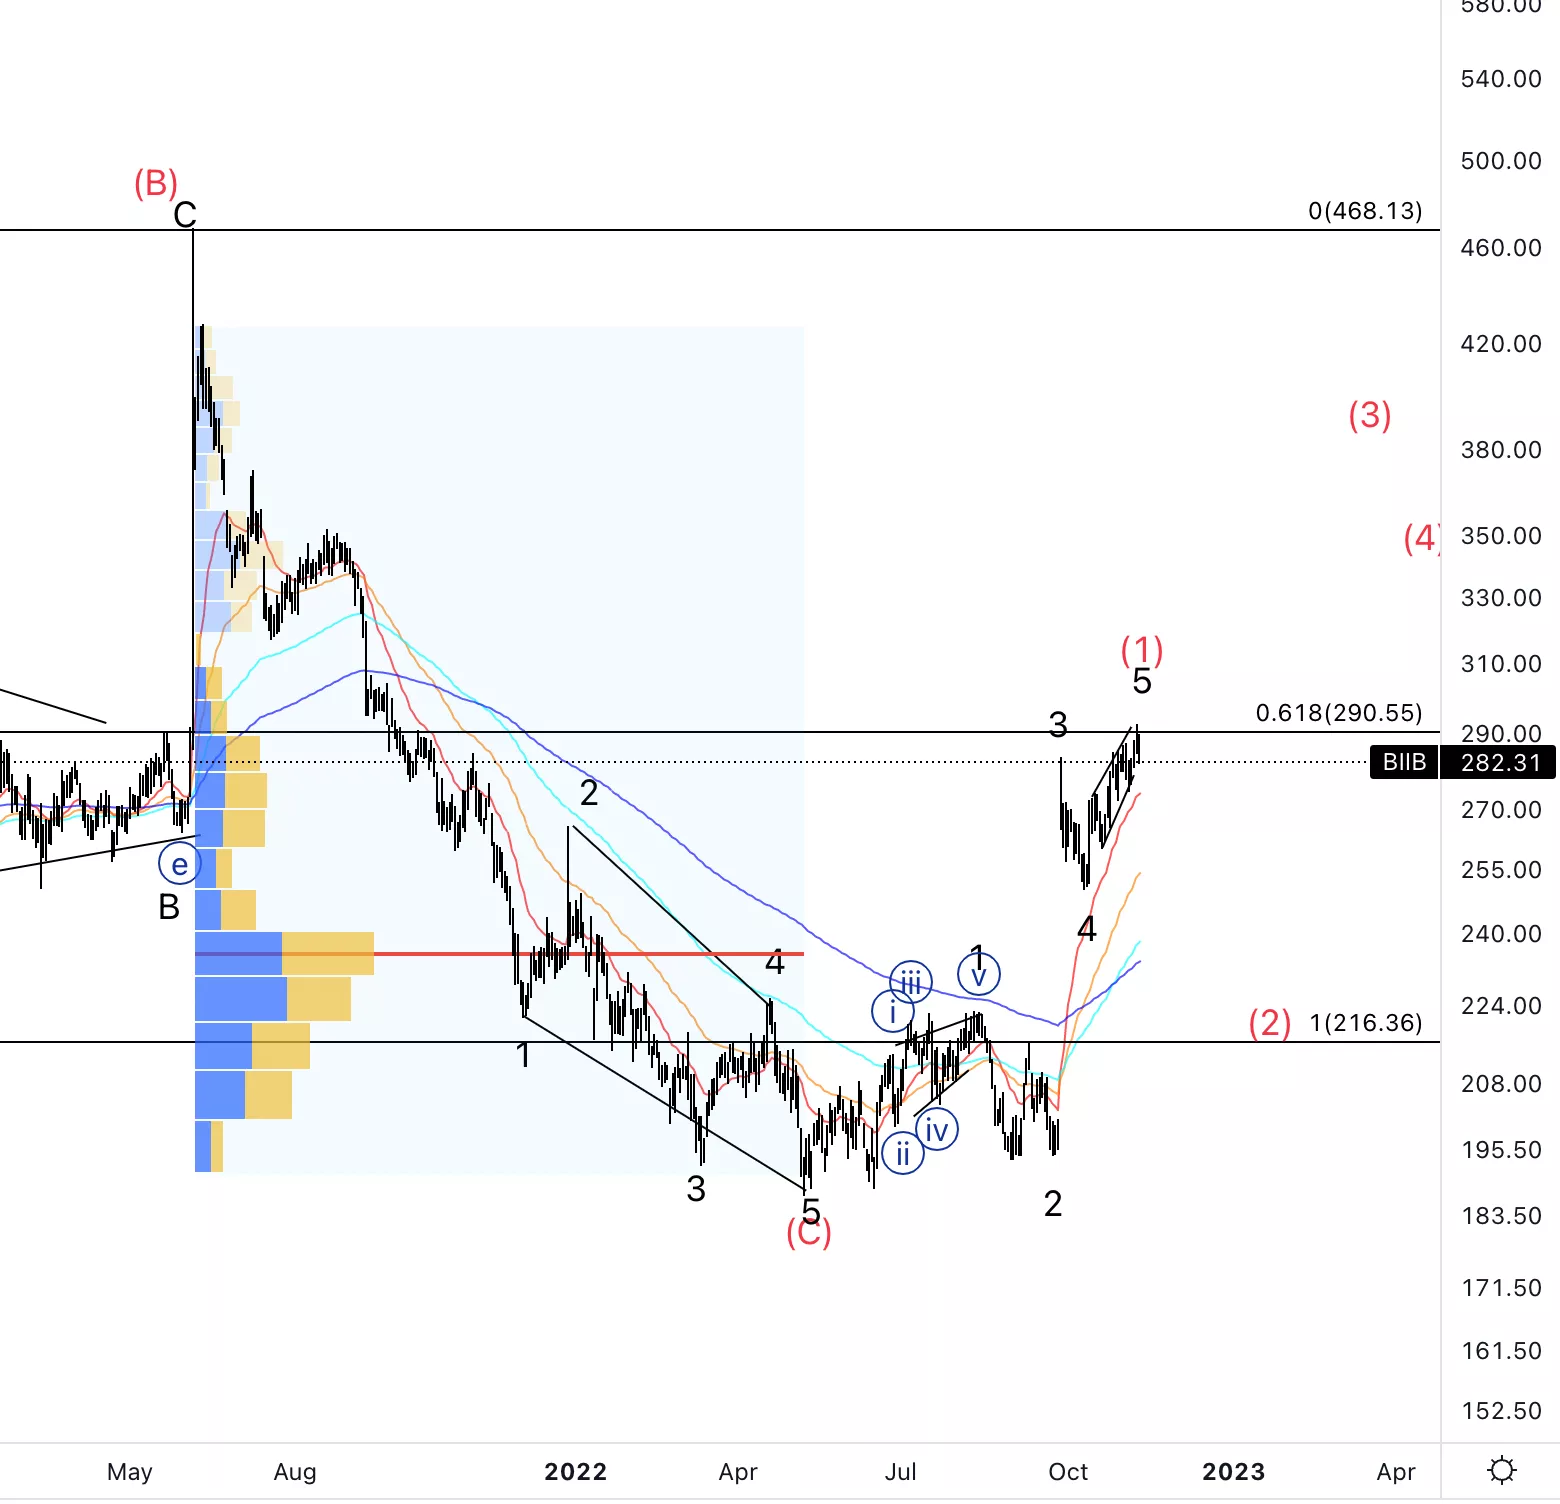
Biogen Inc., (Nasdaq: BIIB) Daily Chart, November 10, 2022,
BIIB Stock Market Analysis: Looking for a five waves sequence to the upside to find an end soon as we are identifying a potential ending diagonal in wave 5 of (1).
BIIB Elliott Wave Count: Wave 5 of (1).
BIIB Technical Indicators: Above all EMA.
BIIB Trading Strategy: Looking for a clear three-wave move pullback before considering any long-term longs.
Analyst: Alessio Barretta
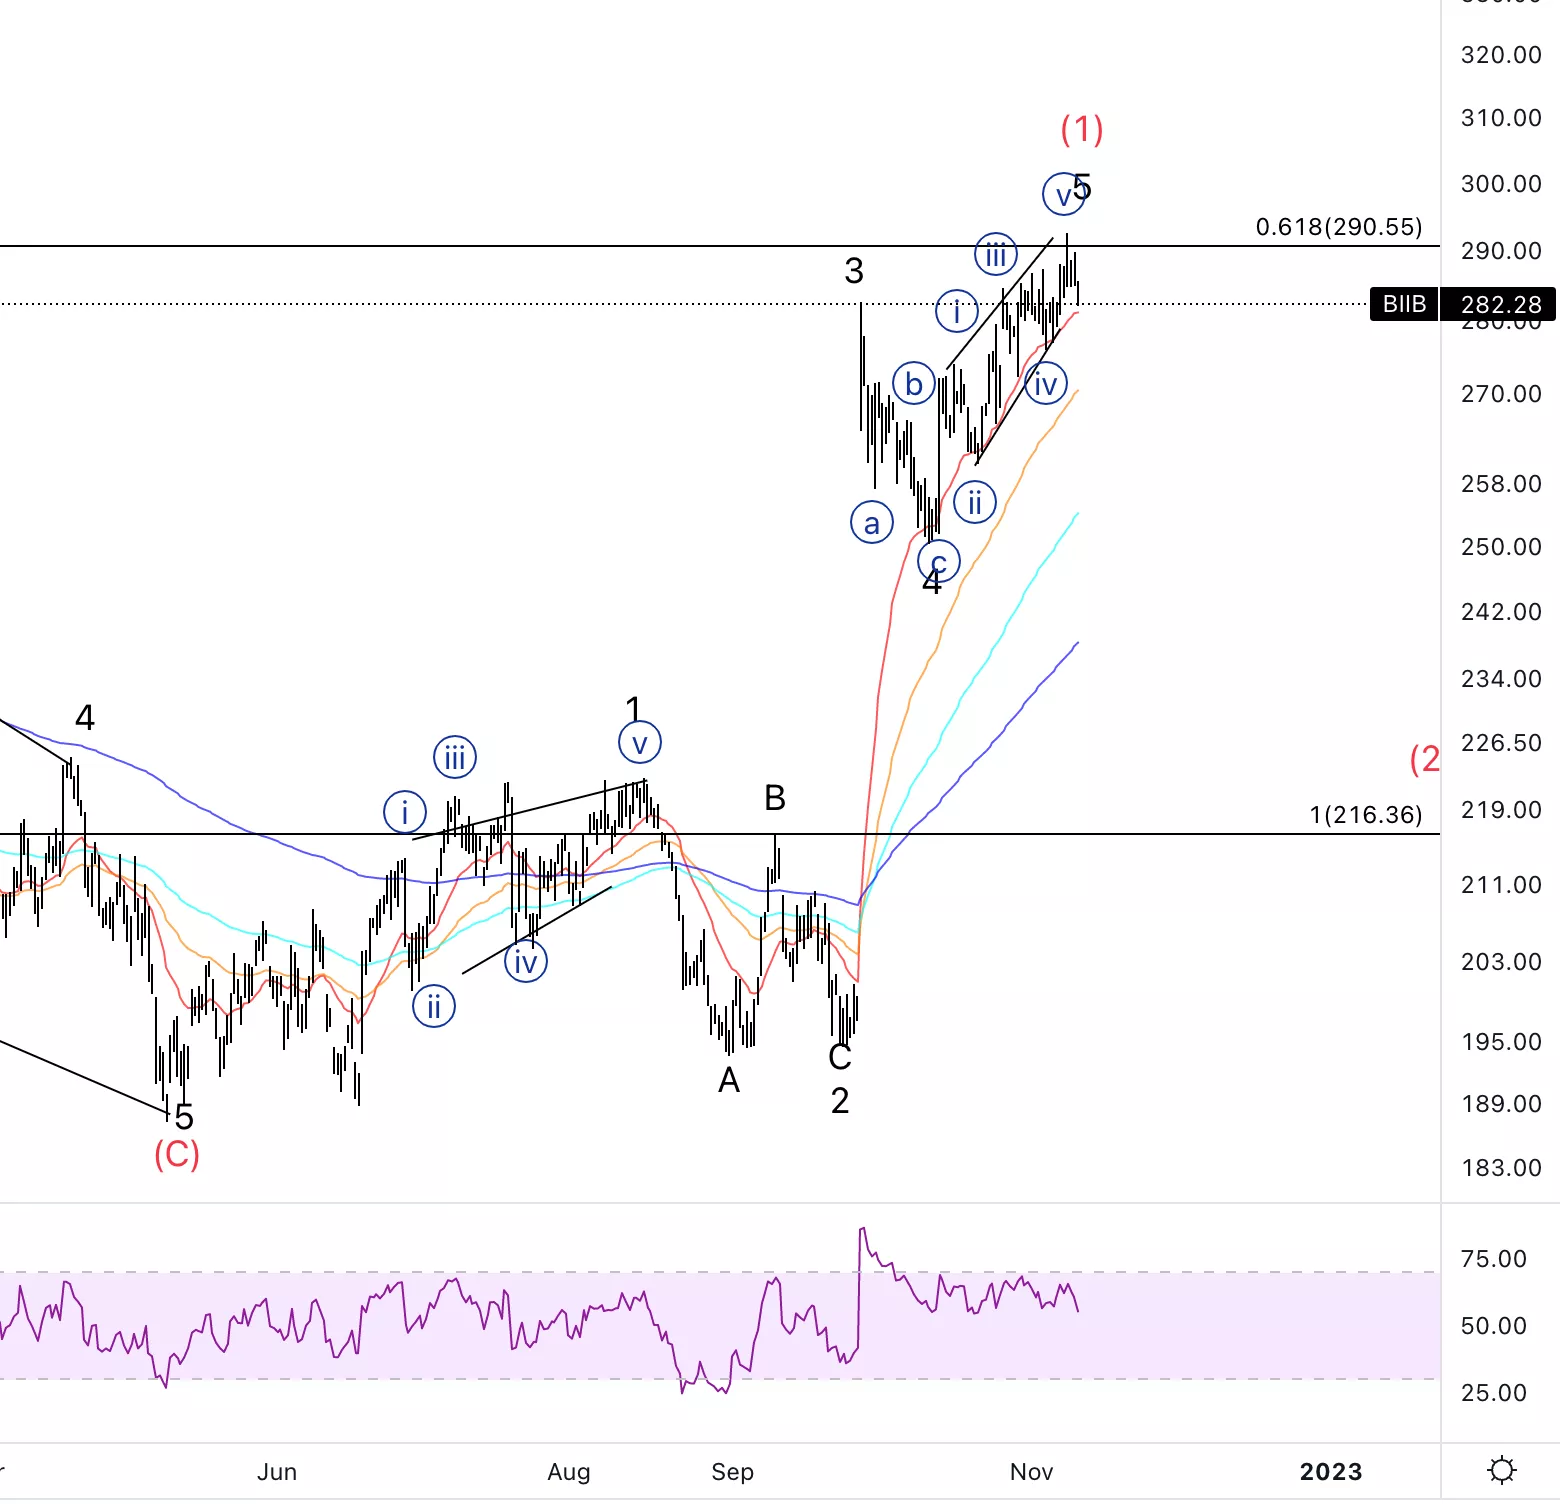
Biogen Inc., BIIB: 4-hour Chart, November 10, 2022
Biogen Inc., Elliott Wave Technical Analysis
BIIB Stock Market Analysis: There is a possibility wave 5 has already finished and we are ready to start moving lower.
BIIB Elliott Wave count: Wave {v} of 5.
BIIB Technical Indicators: Above all EMAs and RSI have formed bearish divergence.
BIIB Trading Strategy: As the RSI has formed divergence we could expect a sudden and sharp drop anytime soon. Looking to take advantage of those short-term opportunities to the downside.
More By This Author:
Elliott Wave Technical Analysis: ChainLink, Wednesday, Nov. 10
Elliott Wave Technical Analysis: Analog Devices Inc. - Wednesday, Nov. 9
Elliott Wave Technical Analysis: Bitcoin, Wednesday, Nov. 9


Comments
Log in or sign up to join the conversation.