

PayPal Holdings Inc., Elliott Wave Technical Analysis

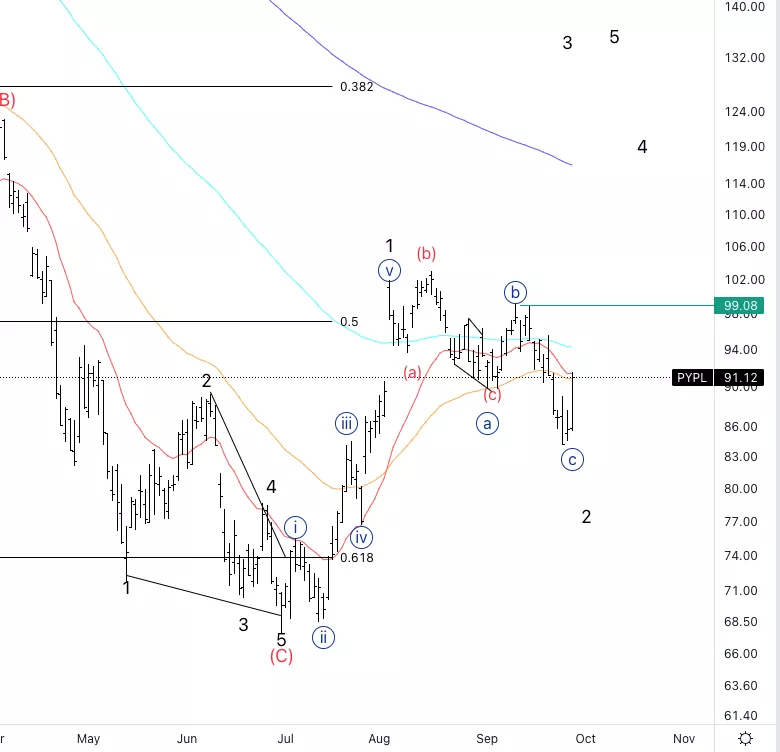
PayPal Holdings Inc.,(PYPL): Daily Chart,September 29 2022
PYPL Stock Market Analysis: It looks like we have a three wave structure to the downside which makes us believe the count is moving as expected.
Waiting for confirmation level to be broken.
PYPL Elliott Wave count:{c} of 2.
PYPL Trading Strategy: Lookinga break of the green line and then a three wave pullback.
PYPL Technical Indicators: We are trying to go back above the 20 EMA.
TradingLounge Analyst: Alessio Barretta
Source Tradinglounge.com
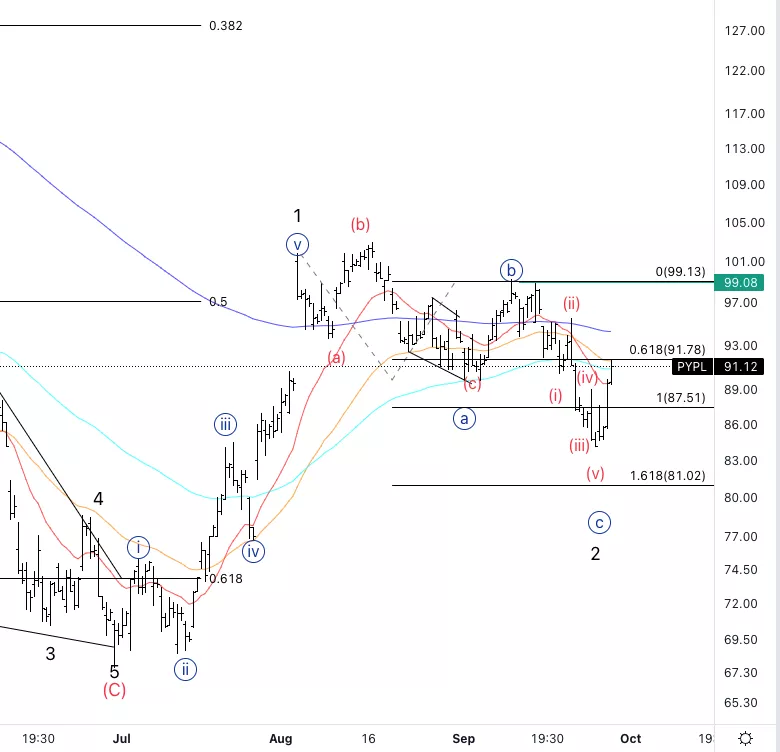
PayPal Holdings Inc., PYPL: 4-hour Chart, September 29 2022
PayPal Holdings Inc., Elliott Wave Technical Analysis
PYPL Stock Market Analysis: The most important thing was to count 5 waves into wave {c} and we can identify them.
PYPL Elliott Wave count:{c} of 2. PYPL Technical Indicators: Above the 20EMa and RSI made a bounce into neutral territory.
PYPL Trading Strategy: Looking a break of the green line and then a three wave pullback.
More By This Author:
Elliott Wave Analysis: VeChain, Sept. 28
Elliott Wave Technical Analysis: Broadcom Inc., Sept. 28
Elliott Wave Analysis: What's Going On In The Markets?



Comments
Log in or sign up to join the conversation.