

Image Source: Unsplash
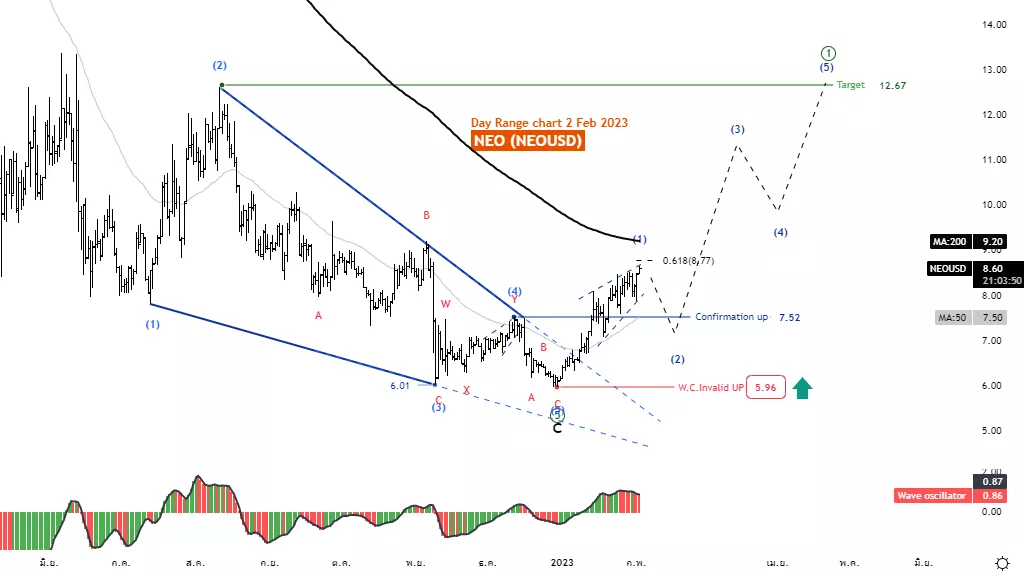
Elliott Wave Analysis TradingLounge Daily Chart, 2 February 23,
NEO / U.S. Dollar(NEOUSD)
NEOUSD Elliott Wave Technical Analysis
Function: Follow trend
Mode: Motive
Structure: Diagonal
Position: Wave 5
Direction Next higher Degrees: Sub-wave of Wave C
Wave Cancel invalid Level: 5.96
NEO / U.S.Dollar (NEOUSD) Trading Strategy: NEO has recovered well from the 5.96 level, but even so, the price is still below the MA200, which may still be under pressure from selling pressure. And there is a reversal chance in wave 2 and wait for an opportunity to join the trend again once wave 2 completes.
NEO / U.S.Dollar (NEOUSD) Technical Indicators: The price is below the MA200 indicating a downtrend. The wave oscillators above Zero-Line momentum are bullish.
Analyst: Kittiampon Somboonsod
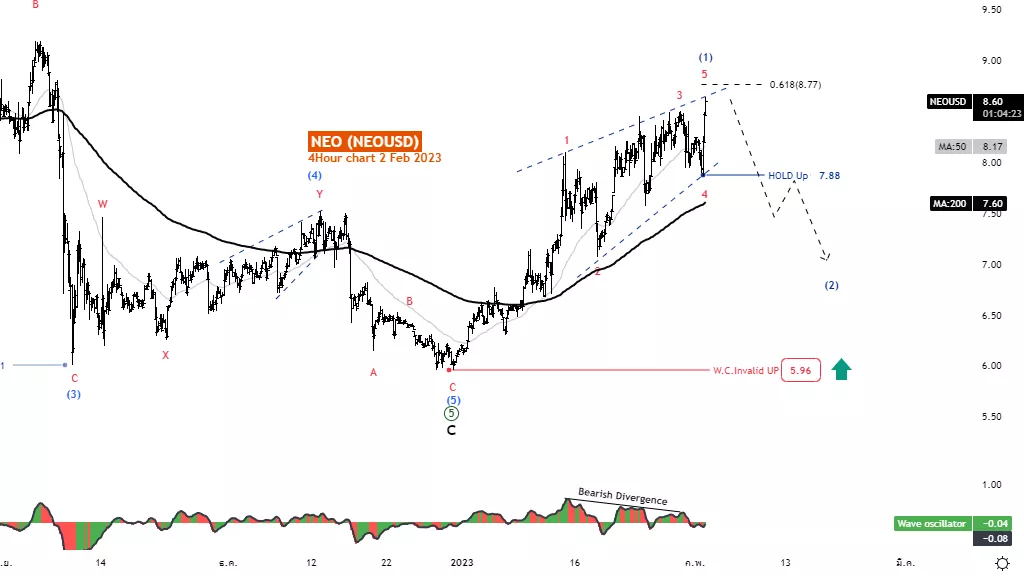
Elliott Wave Analysis TradingLounge 4H Chart, 2 February 23,
NEO / U.S.Dollar(NEOUSD)
NEOUSD Elliott Wave Technical Analysis
Function: Follow trend
Mode: Motive
Structure: Diagonal
Position: Wave 5
Direction Next higher Degrees: Wave (1) of Motive
Wave Cancel invalid Level: 5.96
NEO / U.S.Dollar (NEOUSD) Trading Strategy: Neo Coin is in an Impulse Wave structure, in an uptrend wave 5 is likely to end. Price is reversing in wave (2) larger degrees. Wait for wave (2) complete to rejoin the trend.
NEO / U.S.Dollar (NEOUSD) Technical Indicators: The price is above the MA200, indicating an uptrend.
The wave oscillators above Zero-Line Bullish momentum.
More By This Author:
The Stock Market Continues To Move Higher As Expected
Elliott Wave Technical Analysis: CSX Corp. - Wednesday, Fed. 1
Elliott Wave Technical Analysis: Ethereum / U.S. Dollar


Comments
Log in or sign up to join the conversation.