
KLA Corp., Elliott Wave Technical Analysis

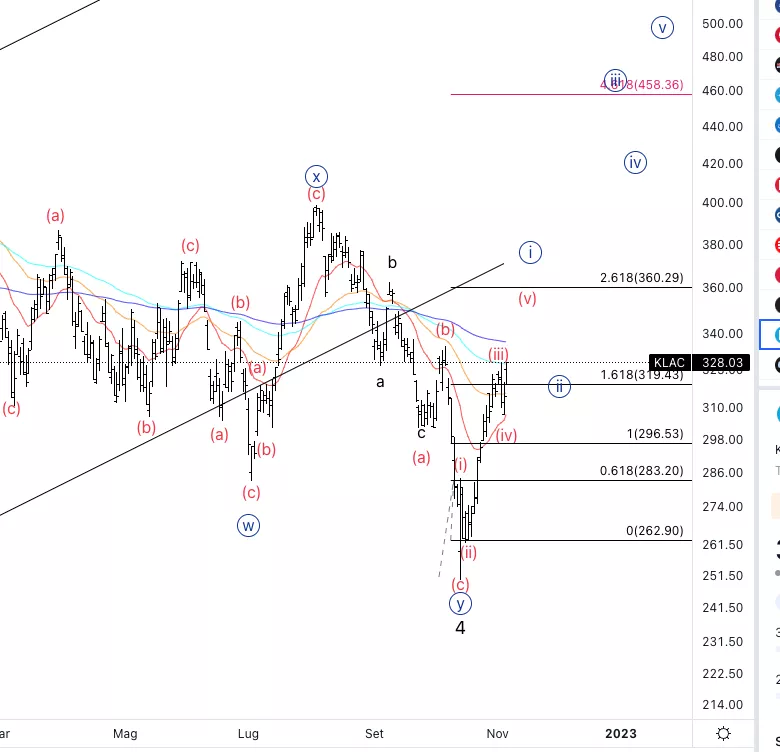
KLA Corp., (KLAC): Daily Chart, November 7, 2022
KLAC Stock Market Analysis: Moving as predicted in the last forecast. It looks like we can have a five wave move off the lows which suggests the uptrend could have resumed.
KLAC Elliott Wave Count: Wave {i} of 5.
KLAC Technical Indicators: Using the 20EMA as support and the 200EMA as resistance.
KLAC Trading Strategy: Looking for a larger pullback into potential wave {ii} to then place longs.
TradingLounge Analyst: Alessio Barretta
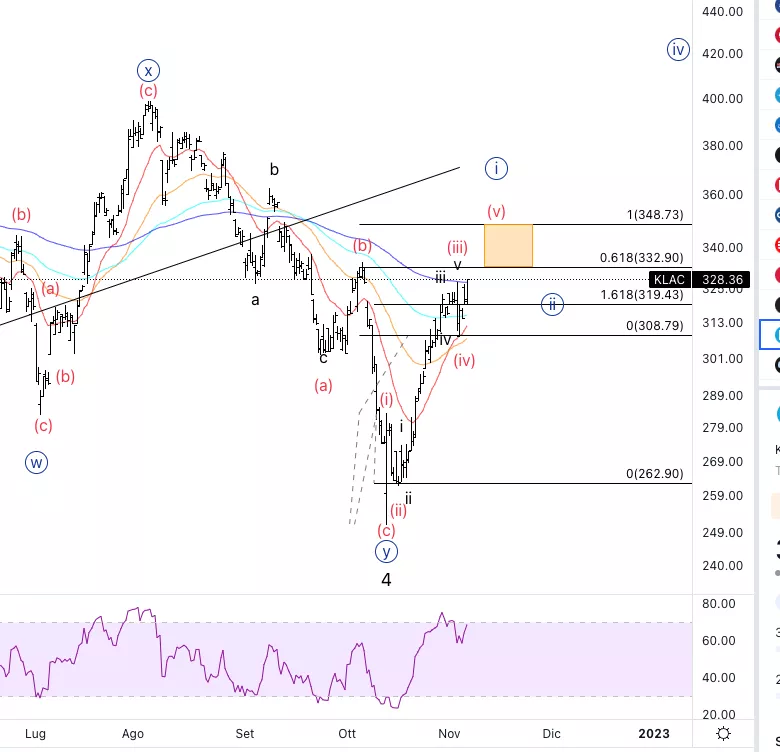
KLA Corp., KLAC: 4-hour Chart, November 7, 2022
KLA Corp., Elliott Wave Technical Analysis
KLAC Stock Market Analysis: We are approaching the yellow area which represents the areabetween the 0.618 and equality of (i) vs (v) which is where I would most likely assume we will be facing resistance.
KLAC Elliott Wave count: Wave (v) of {i}.
KLAC Technical Indicators: Above all EMAs.
KLAC Trading Strategy:You may look for very short term longs into wave (v).
More By This Author:
US Stock Market Analysis Today
Honeywell International Inc Elliott Wave Technical Analysis - Friday, Nov. 4th
DAX 40, FTSE 100, EUROSTOXX 50, DXY, GBPUSD, EURUSD - Elliott Wave Technical Analysis


Comments
Log in or sign up to join the conversation.