
Honeywell International Inc., Elliott Wave Technical Analysis
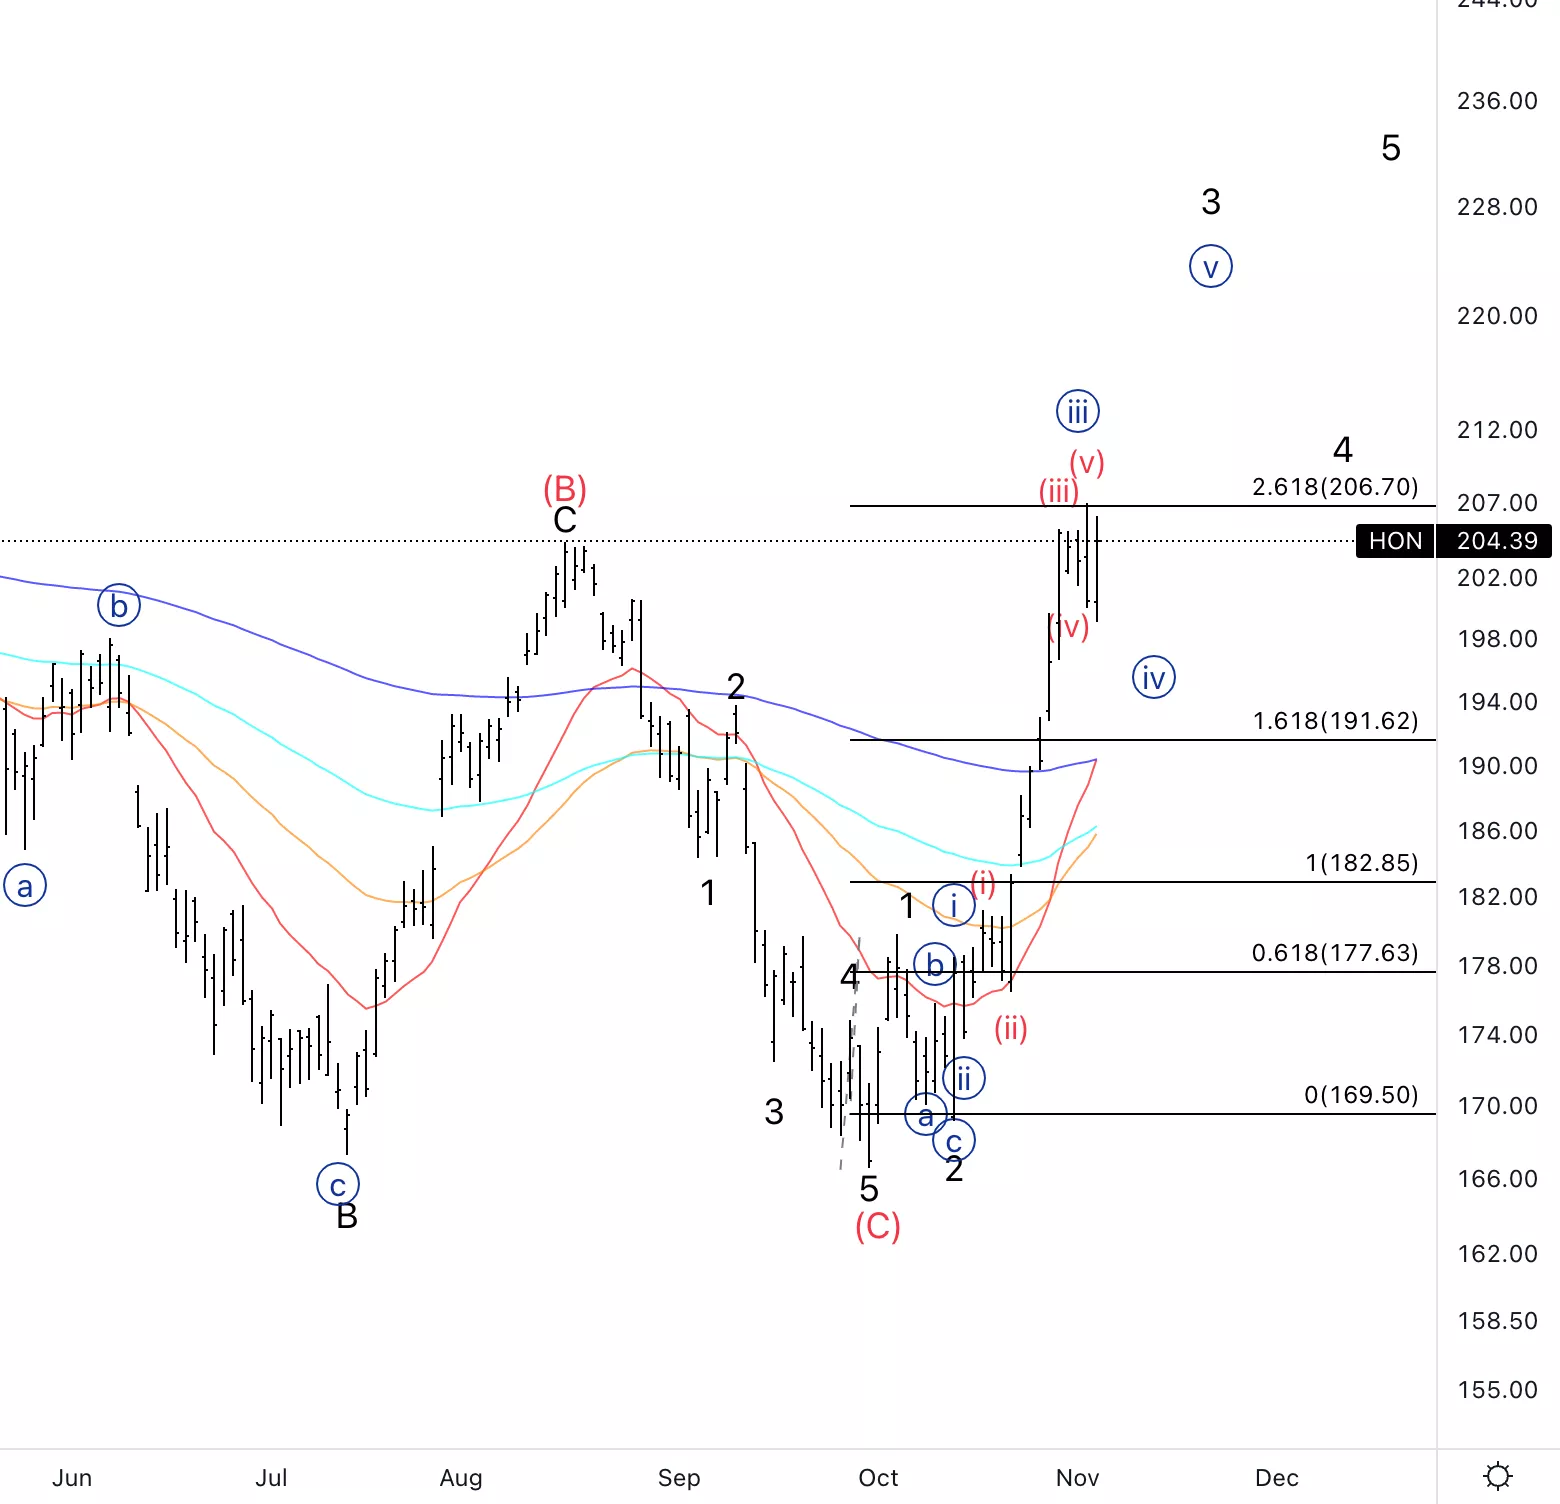
Honeywell International Inc., (HON): Daily Chart, November 4 2022,
HON Stock Market Analysis: Moving l as predicted in the last forecast. We could be in the making of wave {iv} looking for further upside as there should be more room to move higher.
HON Elliott Wave Count: Wave {iv} of 3.
HON Technical Indicators: Above all EMAs.
HON Trading Strategy: Looking for entries within wave {iv} exiting soon as another wave 4could come very soon.
(Click on image to enlarge)
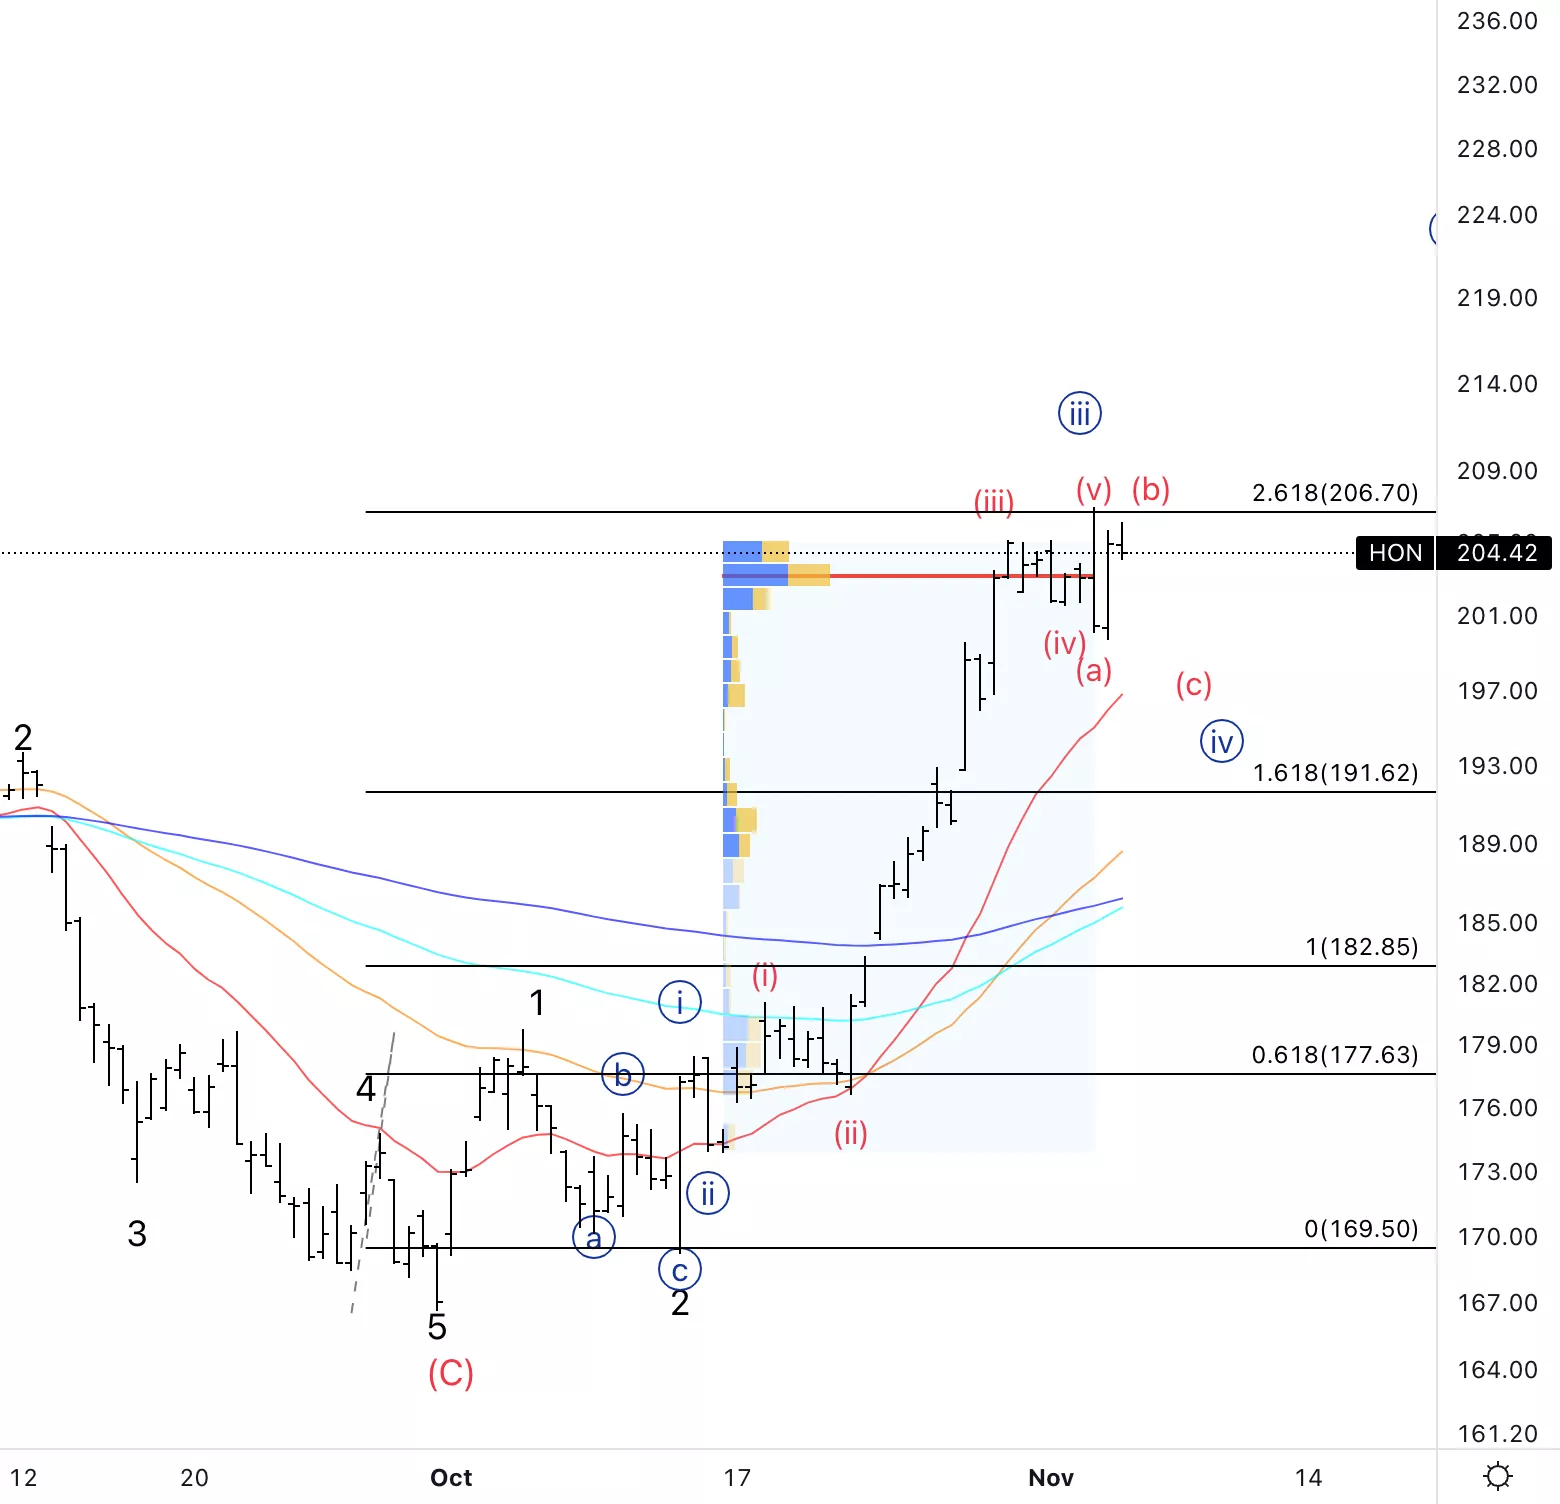
Honeywell International Inc., HON: 4-hour Chart, November 4 2022
Honeywell International Inc., Elliott Wave Technical Analysis
HON Stock Market Analysis: It looks like we could have further downside to come into wave (c)of {iv}.
HON Elliott Wave count: Wave (c) of {iv}.
HON Technical Indicators: Abovee all EMAs.
HON Trading Strategy:Waiting for the completion of wave {iv} before considering longs.
More By This Author:
DAX 40, FTSE 100, EUROSTOXX 50, DXY, GBPUSD, EURUSD - Elliott Wave Technical Analysis
Bitcoin Price Index | BTC Elliott Wave Analysis
S&P 500 Index Elliott Wave: Bear Market Wave (3)


Comments
Log in or sign up to join the conversation.