

Image Source: Pexels
Intuit Inc., Elliott Wave Technical Analysis
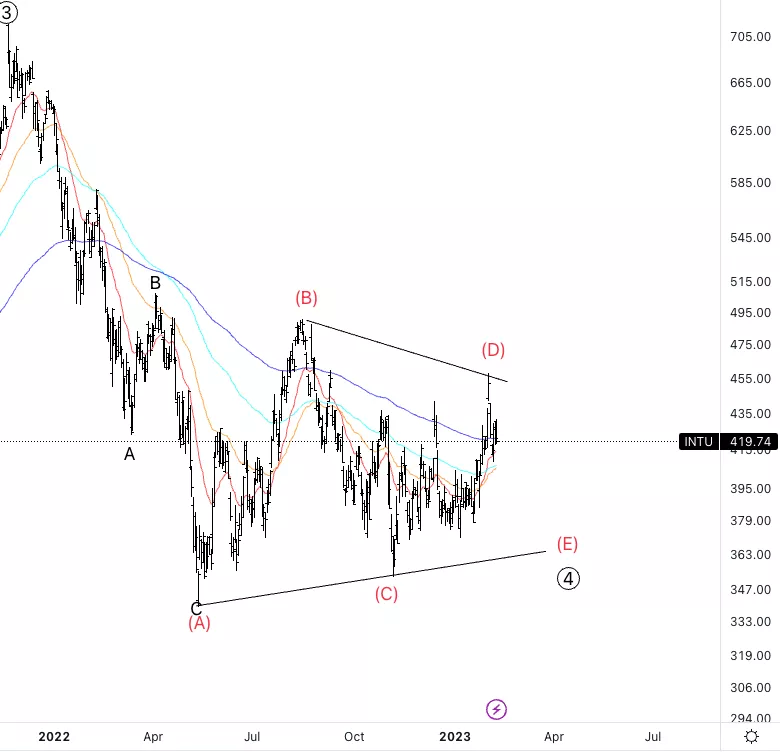
Intuit Inc., (Nasdaq: INTU): Daily Chart, 10 February 2023.
INTU Stock Market Analysis: Looking for further upside into wave 5 with wave 4 being a triangle as charted. We are also rejecting the 200EMA and trying to continue lower into wave (E).
INTU Elliott Wave Count: Wave (E) of 4.
INTU Technical Indicators: broke below the 200EMA.
INTU Trading Strategy: Looking for further downside into wave (E) to look for longs.
Analyst: Alessio Barretta
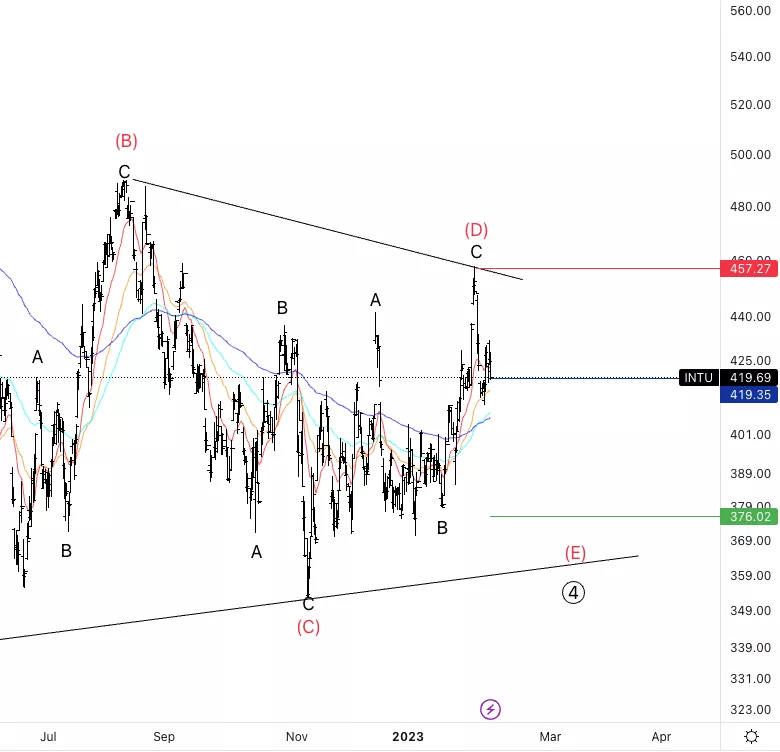
Intuit Inc., INTU: 4-hour Chart, 10 February 2023.
Intuit Inc., Elliott Wave Technical Analysis
INTU Stock Market Analysis: Looking for shorts into wave (E). We had a sharp move down from what could be the top of (D) and it seems we are ready to resume lower as we move below the 20EMA.
INTU Elliott Wave count: Wave {ii} of A.
INTU Technical Indicators: below 20EMA.
INTU Trading Strategy: Looking for downside into wave (E) as labeled.
More By This Author:
SP500 Elliott Wave Analysis - Wave 2 Correction
Elliott Wave Technical Analysis: Texas Instruments Inc. - Thursday, Feb. 9
Elliott Wave Technical Analysis: Polkadot / U.S. Dollar


Comments
Log in or sign up to join the conversation.